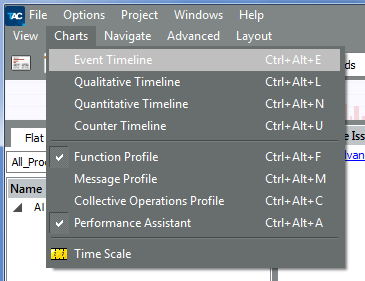
Select the Charts to open various Intel® Trace Analyzer Charts for use during trace analysis.
| Chart: | Keyboard Shortcut: | Description: |
|---|---|---|
| Event Timeline | Ctrl+Alt+E |
Displays the individual process activity. |
| Qualitative Timeline | Ctrl+Alt+L |
Displays event attributes as they occur over time. |
| Quantitative Timeline | Ctrl+Alt+N |
Displays the parallel behavior of the application. |
| Counter Timeline | Ctrl+Alt+U |
Displays the values of all counters that are present in the trace file. |
| Function Profile | Ctrl+Alt+F |
Displays the Function Profile. By default, the Function Profile opens for all newly opened trace files. |
| Message Profile | Ctrl+Alt+M |
Displays the statistical information on MPI point to point messages. |
| Collective Operations Profile | Ctrl+Alt+C |
Displays the statistical information on MPI collective operations. |
| Performance Assistant | Ctrl+Alt+A |
Provides you with the general and detailed information about performance problems. |
| Time Scale | None | Displays the time scale of the project. |