The Function Profile provides detailed profiling information on the performance data.
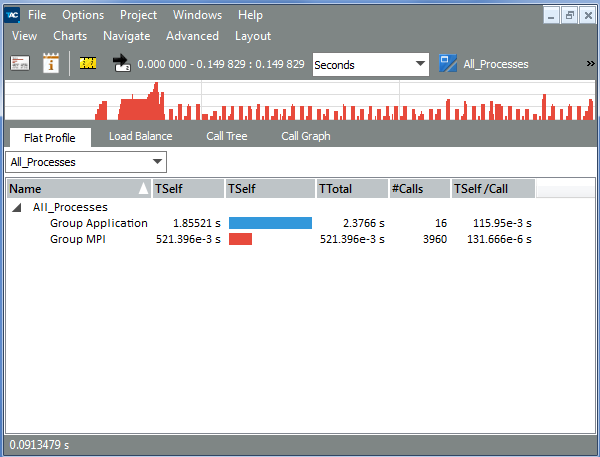
The Function Profile consists of four tabs: Flat Profile, Load Balance, Call Tree and Call Graph. These tabs use the same column headers and the same raw data. The default column headers on display are Name, TSelf, TTotal, #Calls, and TSelf/Call. For a detailed explanation of all available columns refer to the Function Profile Settings section.
Note
The functions in the columns are not in the alphabetical order. You see them in the order given by the layout of the current process or function group.
| Do This: | To Do This: |
|---|---|
| Drag column headings | Adjust the column order |
| Click on a column header | Sort a list in the ascending or descending order. The arrow symbol in the column header indicates whether the entries are arranged in the ascending or descending order. |
| Click TSelf | See which process spends the most time (or the least time) in a function |
| Go to Options > Preferences > Number Formatting | Set number formatting: increase or decrease the number of digits in numbers shown. |