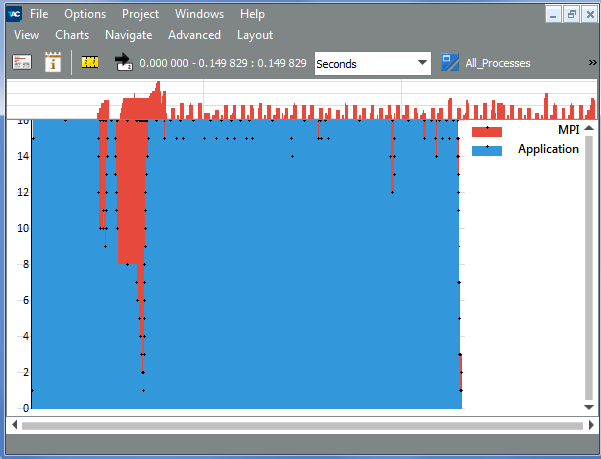
The Quantitative Timeline gives an overview of the parallel behavior of the application. It shows over time how many processes or threads are involved in which function. To open the Quantitative Timeline, go to Charts > Quantitative Timeline.
Along the time axis, different functions are presented as vertically stacked color bars. The height of these bars is proportional to the number of processes that are currently within the respective function.
