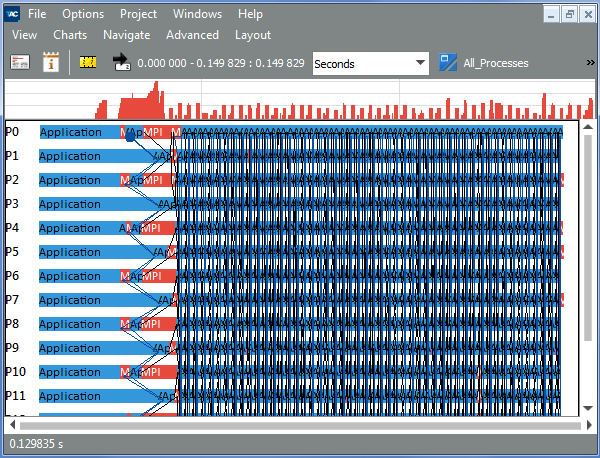
The Event Timeline provides a graphical display of the individual process activities over time. To open the Event Timeline, go to Charts > Event Timeline.
| Element: | Description: |
|---|---|
| Horizontal bars | Represent the processes with the functions called in these processes. The bars consist of colored rectangles labeled with the function names. |
| Black lines | Indicate messages sent between processes. These lines connect sending and receiving processes. |
| Blue lines, forming a grid | Represent collective operations, such as broadcast or reduce operations. |
| Status bar at the bottom of the panel | Shows the entire runtime of the trace. If the mouse cursor hovers over the Event Timeline, the status bar shows information on events under the cursor. To get a better view of events and communications between them, use zooming. |