You can access the context menu by right-clicking on the Event Timeline. Some general context menu options are common to all Charts. Event Timeline provides some options that are specific to this timeline.
Specific Event Timeline context menu options:
| Entry: | Description: |
|---|---|
| Details on Function/Message | Access details on a particular function or message in the Event Timeline |
| Ungroup Group Application/Group MPI | See the OpenMP* regions in the application code or particular MPI functions in the MPI calls |
| Function Colors... | Open Function Group Color Editor (in grouped mode) or color selection dialog (in ungrouped mode) to apply new colors to functions |
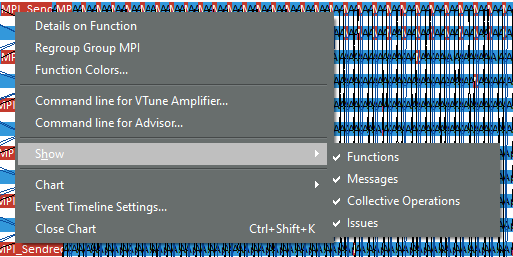
| Show | Select what elements you want to be displayed: functions, messages or collective operations. By default, all of them are displayed in the Event Timeline. |
| Chart | Print, save, clone and move the Chart (for more details, see section Common Chart Features) |
| Event Timeline Settings | Set or reset the Event Timeline preferences |
| Close Chart | Stop using the Event Timeline |
| Command line for VTune Profiler/Advisor... | Open the Command line for Intel® VTune™ Profiler/Intel® Advisor dialog box for selected process |