Intel® Advisor provides several ways to work with the Offload Modeling results generated from the command line.
View Results in CLI
When you run the Offload Modeling perspective from command line,, the result summary is printed in a terminal or a command prompt. In this summary report, you can view:
- Description of a baseline device where application performance was measured and a target device for which the application performance was modeled
- Executive binary name
- Top metrics for measured and estimated (accelerated) application performance
- Top regions recommended for offloading to the target and performance metrics per region
For example:
Info: Selected accelerator to analyze: Intel® Gen11 Integrated Graphics Accelerator 64EU.
Info: Baseline Host: Intel® Core™ i7-9700K CPU @ 3.60GHz, GPU: Intel ® .
Info: Binary Name: 'CFD'.
Info: An unknown atomic access pattern is specified: partial_sums_16. Possible values are same, sequential. sequential will be used.

Measured CPU Time: 44.858s    Accelerated CPU+GPU Time: 16.265s
Speedup for Accelerated Code: 3.5x    Number of Offloads: 7    Fraction of Accelerated Code: 60%

Top Offloaded Regions
---------------------------------------------------------------------------------------------------------------------------------
 Location                                               | CPU      | GPU      | Estimated Speedup | Bounded By | Data Transferred
---------------------------------------------------------------------------------------------------------------------------------
 [loop in compute_flux_ser at euler3d_cpu_ser.cpp:226]  |  36.576s |   9.340s |             3.92x | L3_BW      |         12.091MB
 [loop in compute_step_factor_ser at euler3d_cpu_ser....|   0.844s |   0.101s |             8.37x | LLC_BW     |          4.682MB
 [loop in time_step_ser at euler3d_cpu_ser.cpp:361]     |   0.516s |   0.278s |             1.86x | L3_BW      |         10.506MB
 [loop in time_step_ser at euler3d_cpu_ser.cpp:361]     |   0.456s |   0.278s |             1.64x | L3_BW      |         10.506MB
 [loop in time_step_ser at euler3d_cpu_ser.cpp:361]     |   0.432s |   0.278s |             1.55x | L3_BW      |         10.506MB
---------------------------------------------------------------------------------------------------------------------------------
See Accelerator Metrics reference for more information about the metrics reported.
View Results in GUI
If you run the Offload Modeling perspective from command line, an .advixeproj project is created automatically in the directory specified with --project-dir. This project is interactive and stores all the collected results and analysis configurations. You can view it in the Intel Advisor GUI.
To open the project in GUI, you can run the following command from a command prompt:
advisor-gui <project-dir>
Note
If the report does not open, click Show Result on the Welcome pane.If you run the Offload Modeling perspective from GUI, the result is opened automatically after the collection finishes.
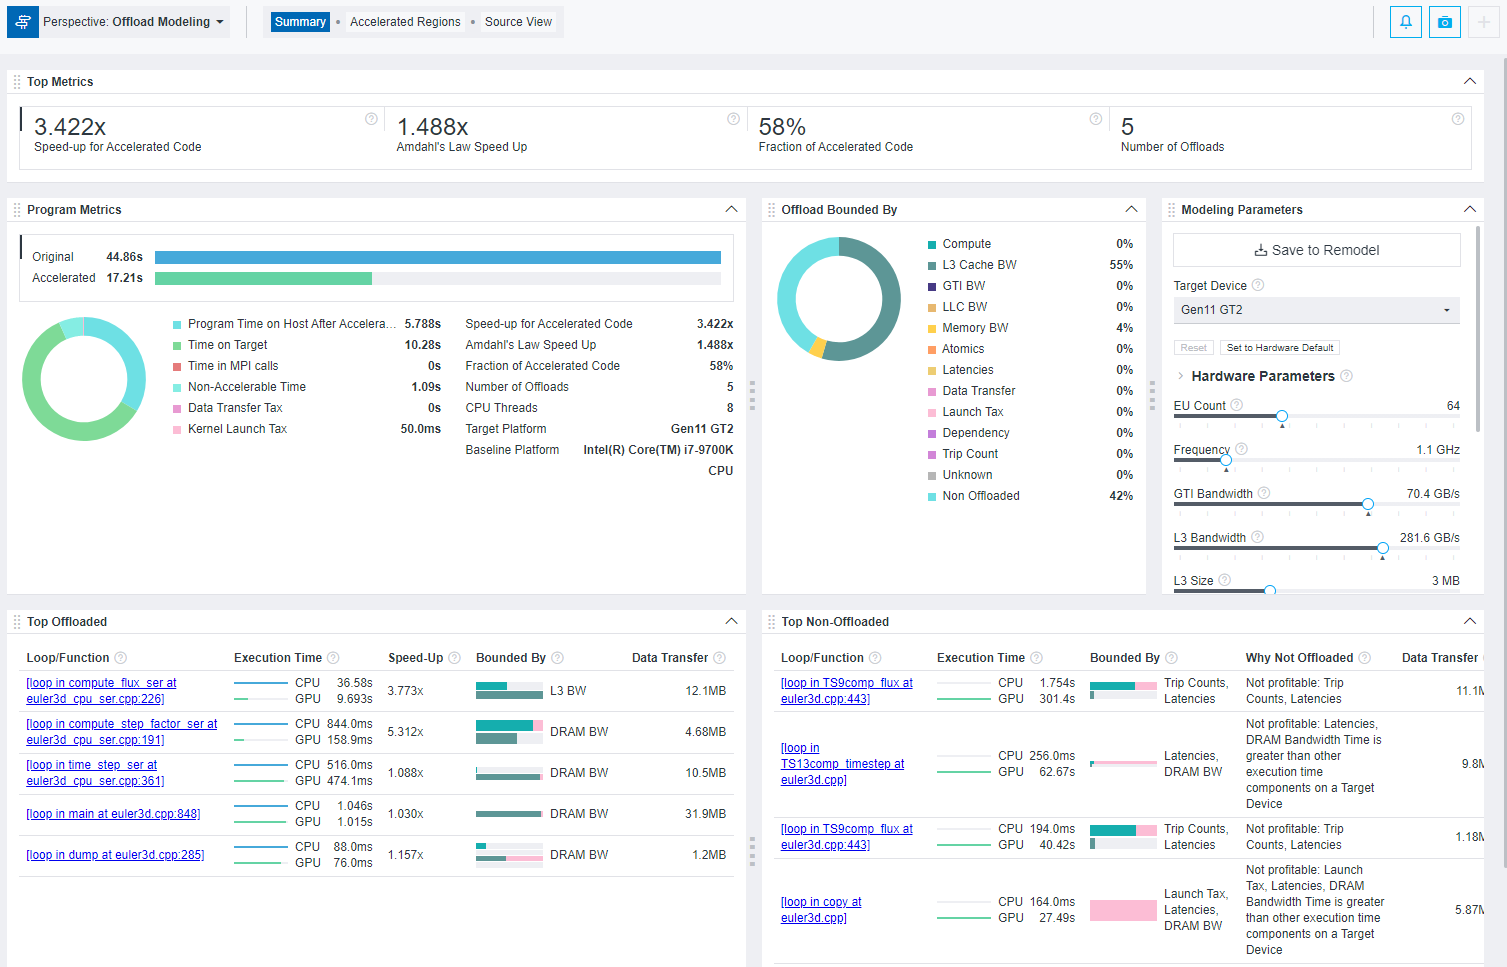
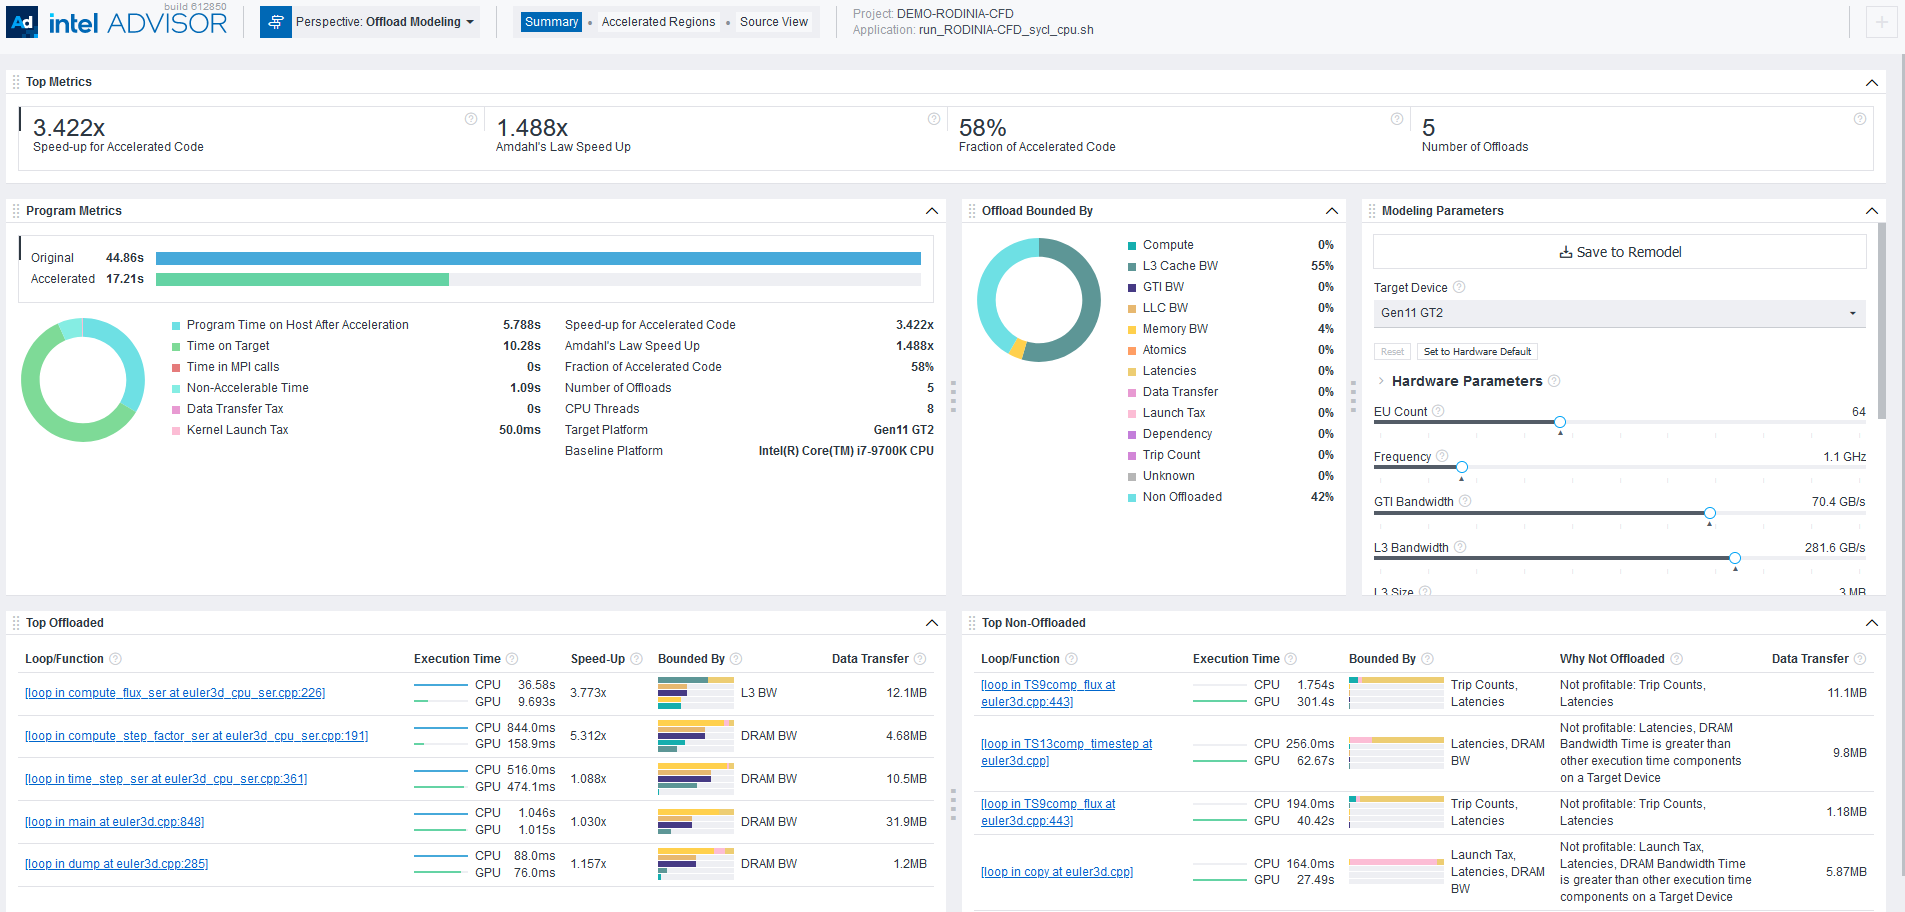
You first see a Summary report that includes the most important information about measured performance on a baseline device and modeled performance on a target device, including:
- Main metrics for the modeled performance of your program that indicates if you should offload your application to a target device.
- Specific factors that prevent your code from achieving a better performance if executed on a target device in the Offload Bounded by.
- Top five offloaded loops/functions that provide the highest benefit and top five not offloaded loops/functions with the reason why they were not offloaded.
View an Interactive HTML Report
When you execute Offload Modeling from CLI, Intel Advisor automatically saves two types of HTML reports in the <project-dir>/e<NNN>/report directory:
- Interactive HTML report that represents results in the similar way as GUI and enables you to view key estimated metrics for your application:
advisor-report.html
Tip
Collect GPU Roofline data to view results for Offload Modeling and GPU Roofline Insights perspectives in a single interactive HTML report. - Legacy HTML report that enables you to get the detailed information about functions in a call tree, download a configuration file for a target accelerator, and view perspective execution logs: report.html.
For details about HTML reports and instructions on exporting them if you run the Offload Modeling from GUI, see Work with Standalone HTML Reports.
To explore the interactive HTML report, you can download precollected Offload Modeling reports and examine the results and structure.
An additional set of reports is generated in the <project-dir>/e<NNN>/pp<NNN>/data0 directory, including:
- Multiple CSV reports for different metric groups, such as report.csv, whole_app_metrics.csv, bounded_by_times.csv, latencies.csv.
- A graphical representation of the call tree showing the offloadable and accelerated regions named as program_tree.dot.
- A graphical representation of the call tree named as program_tree.pdf, which is generated if a DOT* utility is installed on your system.
- LOG files, which can be used for debugging and reporting bugs and issues.
These reports are light-weighted and can be easily shared as they do not require Intel Advisor GUI.
Save a Read-only Result Snapshot
A snapshot is a read-only copy of a project result, which you can view at any time using the Intel Advisor GUI. You can save a snapshot for a project using Intel Advisor GUI or CLI.
To save an active project result as a read-only snapshot from GUI: Click the
 button in the top ribbon of the report. In the
Create a Result Snapshot dialog box, enter the snapshot details and save it.
button in the top ribbon of the report. In the
Create a Result Snapshot dialog box, enter the snapshot details and save it.
To save an active project result as a read-only snapshot from CLI:
advisor --snapshot --project-dir=<project-dir> [--cache-sources] [--cache-binaries] -- <snapshot-path>
where:
- --cache-sources is an option to add application source code to the snapshot.
- --cache-binaries is an option to add application binaries to the snapshot.
- <snapshot-path is a path and a name for the snapshot. For example, if you specify /tmp/new_snapshot, a snapshot is saved in a tmp directory as new_snapshot.advixeexpz. You can skip this and save the snapshot to a current directory as snapshotXXX.advixeexpz.
To open the result snapshot in the Intel Advisor GUI, you can run the following command:
advisor-gui <snapshot-path>
You can visually compare the saved snapshot against the current active result or other snapshot results.
See Create a Read-only Result Snapshot for details.
Result Interpretation
When you run the Offload Modeling perspective, depending on a configuration chosen, the report shows a different level of details:
- Examine regions recommended for offloading and view estimated performance of your application after offloading to a target platform assuming it is mostly bounded by compute limitations. You need to run at least the Survey, Trip Counts and FLOP (Characterization), and Performance Modeling analyses (Low accuracy) to collect this data.
- Examine data transfers estimated for modeled regions and view estimated performance with data transfer estimations between host and target platforms for all memory levels and total data for loop/function. You need to run at least the Survey, Trip Counts and FLOP with callstacks, light data transfer simulation, and cache simulation (Characterization), and Performance Modeling analyses (Medium accuracy) to collect this data.
- Check for dependencies issues and view a more accurate performance estimated considering loop/function dependencies. You need to run at least the Survey, Trip Counts and FLOP with callstacks, cache simulation, and medium data transfer simulation (Characterization), Dependencies, and Performance Modeling analyses (High accuracy) to collect this data.
- Explore performance gain from GPU-to-GPU modeling to see how your DPC++, OpenMP* target, or OpenCL™ application can have a better performance if you run it on a different graphics processing unit (GPU) device.
- Investigate non-offloaded code regions and understand why they are not profitable to run on a target platform. The higher accuracy level you run, the more accurate offload recommendations and non-offloaded reasons are.
For a general overview of the report, see Offload Modeling Report Overview.