This reference section describes the contents of data columns in reports of the Offload Modeling and GPU Roofline Insights perspectives.
# | A | B | C | D | E | F | G | H | I | J | K | L | M | N | O | P | Q | R | S | T | U | V | W | XYZ
#
Note
Families of Intel® Xe graphics products starting with Intel® Arc™ Alchemist (formerly DG2) and newer generations feature GPU architecture terminology that shifts from legacy terms. For more information on the terminology changes and to understand their mapping with legacy content, see GPU Architecture Terminology for Intel® Xe Graphics.2 FPUs Active
Description: Average percentage of time when both floating-point units (FPU) are used.
Collected during the Survey analysis in the GPU Roofline Insights perspective and found in the GPU Roofline Regions tab > GPU Kernels pane > EU Instructions column group.
A
Active
Description: Percentage of cycles actively executing instructions on all execution units (EU) or vector engines (XVE).
Collected during the Survey analysis in the GPU Roofline Insights perspective and found in the GPU Roofline Regions tab > GPU Kernels pane > EU Array column group or GPU Roofline Regions tab > GPU Kernels pane > XVE Array column group (for code running on the Intel® Arc™ graphics code-named Alchemist or newer).
Advanced Diagnostics
Description: Additional information about a code region that might help to understand the achieved performance.
Collected during the Survey analysis in the Offload Modeling perspective and found in the Accelerated Regions tab > Code Regions pane.
Allocation Time
Description: Total time spent on memory allocation.
Collected during the Characterization analysis in the GPU Roofline Insights perspective and found in the GPU Roofline Regions tab > GPU Kernels pane > Data Transferred column group.
Prerequisites for display: Expand the Data Transferred column group.
Atomic Accesses
Description: Total number of atomic memory accesses.
Collected during the Performance Modeling analysis in the Offload Modeling perspective and found in the Accelerated Regions tab > Code Regions pane > Atomics column group.
Atomic Throughput
Description: Average atomic throughput for a kernel, in operations per seconds.
Collected during the Performance Modeling analysis in the Offload Modeling perspective and found in the Accelerated Regions tab > Code Regions pane > Atomics column group.
Prerequisites for display: Expand the Atomics column group.
Atomic Throughput per Cycle
Description: Average atomic throughput for a kernel, in operations per cycle.
Collected during the Performance Modeling analysis in the Offload Modeling perspective and found in the Accelerated Regions tab > Code Regions pane > Atomics column group.
Prerequisites for display: Expand the Atomics column group.
Average Time (GPU Roofline)
Description: Average time spent executing one task instance.
Collected during the Survey analysis in the GPU Roofline Insights perspective and found in the GPU Roofline Regions tab > GPU Kernels pane > Kernel Details column group.
Prerequisites for display: Expand the Kernel Details column.
Average Time (Offload Modeling)
Description: Average time spent executing one task instance. This metric is only available for the GPU-to-GPU modeling.
Collected during the Survey analysis with enabled GPU profiling in the Offload Modeling perspective and found in the Accelerated Regions tab > Code Regions pane > Measured column group.
Prerequisites for display: Expand the Measured column.
Average Trip Count
Description: Average number of times a loop/function is executed.
Collected during the Trip Counts (Characterization) in the Offload Modeling perspective and found in the Accelerated Regions tab > Code Regions pane > Measured column group.
Prerequisites for display: Expand the Measured column group.
B
Bandwidth, GB/s (GPU Memory)
Description: Rate at which data is transferred to and from GPU, chip uncore (LLC), and main memory, in gigabytes.
Collected during the Survey analysis in the GPU Roofline Insights perspective and found in the GPU Roofline Regions tab > GPU Kernels pane > GPU Memory column group.
Prerequisite for display: Expand the GPU Memory column. This metric is also shown in the collapsed GPU Memory column.
Bandwidth, GB/s (L3 Shader)
Description: Rate at which data is transferred between execution units or vector engines and L3 caches, in gigabytes per second.
Collected during the Survey analysis in the GPU Roofline Insights perspective and found in the GPU Roofline Regions tab > GPU Kernels pane > L3 Shader column group.
Prerequisite for display: Expand the L3 Shader column. This metric is also shown in the collapsed L3 Shader column.
Bandwidth, GB/s (SLM)
Description: Rate at which data is transferred to and from shared local memory (SLM), in gigabytes per second.
Collected during the Survey analysis in the GPU Roofline Insights perspective and found in the GPU Roofline Regions report > GPU Kernels pane > SLM column group.
Prerequisites for display: Expand the SLM column. This metric is also shown in the collapsed SLM column.
Baseline Device
Description: Host platform that application is executed on.
Collected during the Survey analysis in the Offload Modeling perspective and found in the Accelerated Regions tab > Code Regions pane > Measured column group.
Prerequisite for display: Expand the Measured column group.
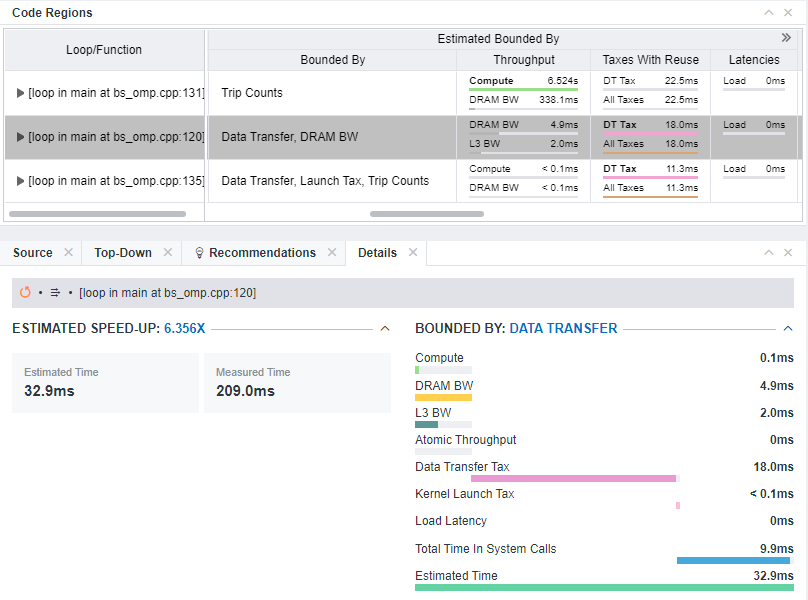
Bounded By
Description: List of main factors that limit the estimated performance of a code region offloaded to a target device.
Collected during the Performance Modeling analysis in the Offload Modeling perspective and found in the Accelerated Regions tab > Code Regions pane > Basic Estimated Metrics column group.
Interpretation: This metric shows one or more bottleneck(s) in a code region.
Category |
Bottleneck |
Description |
|---|---|---|
Algorithmic |
Dependencies |
Data dependencies limit the parallel execution efficiency. Fix the dependencies to offload this code region. |
Kernel Decomposition |
The workload decomposition strategy does not allow to schedule enough parallel threads to use all execution units or vector engines on a selected target device. |
|
Trip Counts |
The number of loop iterations is not enough to use all execution units or vector engines on a selected target device. |
|
Taxes |
Data Transfer |
Data transfer tax is greater than the sum of the maximum throughput time and latencies time. |
Launch Tax |
Kernel launch tax is greater than the sum of the maximum throughput time and latencies time. |
|
Throughput |
Compute |
The code region uses full target device capabilities, but the compute time is still high. The time is greater than all other execution time components on a target device. |
Global Atomics |
Global atomics bandwidth time is greater than all other execution time components on a target device. |
|
Memory Sub-System bandwidth (BW): for example, L3 BW, LLC BW, DRAM BW |
Memory sub-system bandwidth time is greater than all other execution time components on a target device. |
|
Latencies |
Latencies |
Instruction latency is greater than the maximum throughput time. |
Resulting estimated time is calculated as a sum of the four factors: throughput, latency, and taxes, which include data transfer taxes and submission tax:
Time = max_throughput_bottleneck_time + non_overlaped_latency + data_transfer_time + kernel_submission_taxes_time
The model assumes that throughput-defined times are fully "overlapped" and chooses only a "maximum" throughput bottleneck to show in the column. If the impact of other components is comparable to the throughput component, top bottlenecks of all four factors (one for throughput, one for latency, and one for data transfer/submission) are shown in this column. This means the code region is limited by this combination of factors, which is ordered by the impact on the region performance.
Otherwise, for example, if the relative throughput impact is much higher than the latency and data transfer ones, only the maximum throughput bottleneck is shown as dominating over others. If the maximum throughput time is compute, Intel Advisor assumes the algorithmic factors (dependencies, kernel decomposition, trip counts) limit offloading a code region.
For example, the combined Data Transfer, DRAM BW value means the following:
- The main limiting factor for the code region is data transfer tax. The tax is greater than the sum of the maximum throughput time and latencies time for this region.
- The second limiting factor for the code region is the DRAM bandwidth time. The time is greater than other execution time components on a target device.
Cache Line Utilization
Description: Fraction of global memory traffic used by execution units or vector engines.
Collected during the Survey analysis with GPU profiling enabled in the GPU Roofline Insights perspective and found in the GPU Roofline Regions tab > GPU Kernels pane > L3 Shader column group.
Prerequisites for display: Expand the L3 Shader column group. This metric is also shown in the collapsed L3 Shader column.
Calculation: Ratio of global memory traffic to the observed cache traffic, where:
- Global memory traffic is traffic between execution units or vector engines and cache data ports, in cache-line granularity transactions.
- Observed cache traffic is traffic between a data port and caches, in cache-line granularity transactions.
Interpretation: If you see a low value, it may indicate that the kernel has an inefficient or not GPU-friendly memory access pattern.
Call Count
Description: Number of times a loop/function was invoked.
Collected during the Trip Counts (Characterization) in the Offload Modeling perspective and found in the Accelerated Regions tab > Code Regions pane > Measured column group.
Prerequisites for display: Expand the Measured column group.
CARM, GB
Description: Total data transferred to and from execution units or vector engines, in gigabytes..
Collected during the Characterization analysis with GPU profiling in the GPU Roofline Insights perspective and found in the GPU Roofline Regions tab > GPU Kernels pane.
Compute
Description: Estimated execution time assuming an offloaded loop is bound only by compute throughput.
Collected during the Performance Modeling analysis in the Offload Modeling perspective and found in the Estimated Bounded By column group in the Accelerated Regions tab > Code Regions pane.
Prerequisite for display: Expand the Estimated Bounded By column group.
Computing Threads Started
Description: Total number of threads started across all execution units or vector engines for a computing task.
Collected during the Survey analysis in the GPU Roofline Insights perspective and found in the GPU Roofline Regions tab > GPU Kernels pane.
D
- Data Transfer Tax
- Data Transfer Tax without Reuse
- Data Reuse Gain
- Dependency Type
- Device-to-Host Size
- Device-to-Host Time
- DRAM
- DRAM BW (Estimated Bounded By)
- DRAM BW (Memory Estimations)
- DRAM BW Utilization
- DRAM Read Traffic
- DRAM Traffic
- DRAM Write Traffic
Data Transfer Tax
Description: Estimated time cost, in milliseconds, for transferring loop data between host and target platform. If you enabled the data reuse analysis for the Performance Modeling, the metric value is calculated considering data is reused between code regions on a target platform.
Collected during the Characterization analysis with Trip Counts in the Offload Modeling perspective and found in the Accelerated Regions tab > Code Regions pane > Estimated Bounded By column group.
Prerequisites for collection:
- GUI: From the Analysis Workflow pane, set the Data Transfer Simulation to Light, Medium, or Full.
- CLI: Run the --collect=tripcounts action with the --data-transfer=[full | medium | light] action options.
Prerequisite for display: Expand the Estimated Bounded By column group.
Data Transfer Tax without Reuse
Description: Estimated time cost, in milliseconds, for transferring loop data between host and target platforms considering data is not reused. This metric is available only if you enabled the data reuse analysis for the Performance Modeling.
Collected during the Characterization analysis with Trip Counts and Performance Modeling analysis in the Offload Modeling perspective and found in the Accelerated Regions tab > Code Regions pane > Estimated Bounded By column group.
Prerequisite for collection:
- GUI: From the Analysis Workflow pane, set the Data Transfer Simulation under Characterization to Full and enable the Data Reuse Analysis checkbox under Performance Modeling.
- CLI: Use the --data-transfer=full action option with the --collect=tripcounts action and the --data-reuse-analysis option with the --collect=tripcounts and --collect=projection actions.
Prerequisite for display: Expand the Estimated Bounded By column group.
Data Reuse Gain
Description: Difference between data transfer time estimated with data reuse and without data reuse, in milliseconds. This option is available only if you enabled the data reuse analysis for the Performance Modeling.
Collected during the Characterization analysis with Trip Counts and Performance Modeling analysis in the Offload Modeling perspective and found in the Accelerated Regions tab > Code Regions pane > Estimated Bounded By column group.
Prerequisite for collection:
- GUI: From the Analysis Workflow pane, set the Data Transfer Simulation under Characterization to Full and enable the Data Reuse Analysis checkbox under Performance Modeling.
- CLI: Use the --data-transfer=full action option with the --collect=tripcounts action and the --data-reuse-analysis option with the --collect=tripcounts and --collect=projection actions.
Prerequisite for display: Expand the Estimated Bounded By column group.
Dependency Type
Description: Dependency absence or presence in a loop across iterations.
Collected during the Survey and Dependencies analyses in the Offload Modeling perspective and found in the Accelerated Regions tab > Code Regions pane > Measured column group.
Prerequisite for display: Expand the Measured column group.
Possible values:
- Parallel: Explicit - The loop does not have dependencies because it is explicitly vectorized or threaded on CPU.
- Parallel: Proven - A compiler did not detect dependencies in the loop at the compile time but did not vectorize the loop automatically for a certain reason.
- Parallel: Kernel (GPU-to-GPU modeling only) - The kernel is executed on a GPU.
- Parallel: Programming Model - The loop does not have dependencies because it is parallelized for execution on a target platform using a performance model (for example, OpenMP*, oneAPI Treading Building Blocks, Intel® oneAPI Data Analytics Library, Data Parallel C++).
- Parallel: Workload - Intel Advisor did not find dependencies in the loop based on the workload analyzed during the Dependencies analysis.
- Parallel: User - The loop is marked as not having dependencies with the --set-parallel=<string> option.
- Parallel: Assumed - Intel Advisor does not have information about loop dependencies but it assumed all such loops are parallel (that is, not having dependencies).
- Dependency: <dependency-type> - Intel Advisor found dependencies of specific types in the loop during the Dependencies analysis. Possible dependency types are RAW (read after write), WAR (write after read), WAW (write after read), Reduction.
- Dependency: User - The loop is marked as having dependencies with the --set-dependency=<string> option.
- Dependency: Assumed - Intel Advisor does not have information about dependencies for this loops but it assumes all such loops have dependencies.
Prerequisites for collection/display:
Some values in this column can appear only if you select specific options when collecting data or run the Dependencies analysis:
For Parallel: Workload and Dependency: <dependency-type>:
- GUI: Enable Dependencies analysis in the Analysis Workflow pane.
- CLI: Run advisor --collect=dependencies --project-dir=<project-dir> [<options>] -- <target>. See advisor Command Option Reference for details.
For Parallel: User:
- GUI: Go to Project Properties > Performance Modeling. In the Other parameters field, enter a --set-parallel=<string> and a comma-separated list of loop IDs and/or source locations to mark them as parallel.
- CLI: Specify a comma-separated list of loop IDs and/or source locations with the --set-parallel=<string> option when modeling performance with advisor --collect=projection.
For Dependency: User:
- GUI: Go to Project Properties > Performance Modeling. In the Other parameters field, enter a --set-dependency=<string> and a comma-separated list of loop IDs and/or source locations to mark them as having dependencies.
- CLI: Specify a comma-separated list of loop IDs and/or source locations with the --set-dependency=<string> option when modeling performance with advisor --collect=projection.
For Parallel: Assumed:
- GUI: Disable Assume Dependencies under Performance Modeling analysis in the Analysis Workflow pane.
- CLI: Use the --no-assume-dependencies option when modeling performance with advisor --collect=projection.
For Dependencies: Assumed:
- GUI: Enable Assume Dependencies under Performance Modeling analysis in the Analysis Workflow pane.
- CLI: Use the --assume-dependencies option when modeling performance with advisor --collect=projection.
Interpretation:
- Loops with no real dependencies (Parallel: Explicit, Parallel: Proven, Parallel: Programming Model, and Parallel: User if you know that marked loops are parallel) can be safely offloaded to a target platform.
- If many loops have Parallel: Assumed or Dependencies: Assumed value, you are recommended to run the Dependencies analysis. See Check How Assumed Dependencies Affect Modeling for details.
Device-to-Host Size
Description: Total data transferred from device to host.
Collected during the FLOP analysis (Characterization) in the GPU Roofline Insights perspective and found in the GPU Roofline Regions tab > GPU Kernels pane > Data Transferred column group.
Prerequisites for display: Expand the Data Transferred column group.
Device-to-Host Time
Description: Total time spent on transferring data from device to host.
Collected during the FLOP analysis (Characterization) in the GPU Roofline Insights perspective and found in the GPU Roofline Regions tab > GPU Kernels pane > Data Transferred column group.
Prerequisites for display: Expand the Data Transferred column group.
DRAM
Description: Summary of estimated DRAM memory usage, including DRAM bandwidth, in gigabytes per second, and total DRAM traffic calculated as sum of read and write traffic.
Collected during the Trip Counts (Characterization) and Performance Modeling analyses in the Offload Modeling perspective and found in the Accelerated Regions tab > Code Regions pane > Memory Estimations column group.
Prerequisites for collection:
- GUI: From the Analysis Workflow pane, enable the Cache Simulation checkbox.
- CLI: Run the --collect=tripcounts action with the --enable-cache-simulation and --target-device=<device> action options.
DRAM BW (Estimated Bounded By)
Description: DRAM Bandwidth. Estimated time, in seconds, spent on reading from DRAM memory and writing to DRAM memory assuming a maximum DRAM memory bandwidth is achieved.
Collected during the Trip Counts analysis (Characterization) and the Performance Modeling analysis in the Offload Modeling perspective and found in the Accelerated Regions tab > Code Regions pane > Estimated Bounded By column group.
Prerequisite for display: Expand the Estimated Bounded By column group.
DRAM BW (Memory Estimations)
Description: DRAM Bandwidth. Estimated rate at which data is transferred to and from the DRAM, in gigabytes per second.
Collected during the Trip Counts (Characterization) and Performance Modeling analyses in the Offload Modeling perspective and found in the Accelerated Regions tab > Code Regions pane > Memory Estimations column group.
Prerequisites for collection:
- GUI: From the Analysis Workflow pane, enable the Cache Simulation checkbox.
- CLI: Run the --collect=tripcounts action with the --enable-cache-simulation and --target-device=<device> action options.
Prerequisites for display: Expand the Memory Estimations column group.
DRAM BW Utilization
Description: Estimated DRAM bandwidth utilization, in per cent.
Collected during the Trip Counts (Characterization) and Performance Modeling analyses in the Offload Modeling perspective and found in the Memory Estimations column group in the Code Regions pane of the Accelerated Regions tab.
Prerequisites for collection:
GUI: From the Analysis Workflow pane, enable the Cache Simulation checkbox.
CLI: Run the --collect=tripcounts action with the --enable-cache-simulation and --target-device=<device> action options.
Prerequisites for display: Expand the Memory Estimations column group.
Calculation: Ratio of average bandwidth to a maximum theoretical bandwidth.
DRAM Read Traffic
Description: Total estimated data read from the DRAM memory.
Collected during the Trip Counts (Characterization) and Performance Modeling analyses in the Offload Modeling perspective and found in the Accelerated Regions tab > Code Regions pane > Memory Estimations column group.
Prerequisites for collection:
- GUI: From the Analysis Workflow pane, enable the Cache Simulation checkbox.
- CLI: Run the --collect=tripcounts action with the --enable-cache-simulation and --target-device=<device> action options.
Prerequisites for display: Expand the Memory Estimations column group.
DRAM Traffic
Description: Estimated sum of data read from and written to the DRAM memory.
Collected during the Trip Counts (Characterization) and Performance Modeling analyses in the Offload Modeling perspective and found in the Accelerated Regions tab > Code Regions pane > Memory Estimations column group.
Prerequisites for collection:
- GUI: From the Analysis Workflow pane, enable the Cache Simulation checkbox.
- CLI: Run the --collect=tripcounts action with the --enable-cache-simulation and --target-device=<device> action options.
Prerequisites for display: Expand the Memory Estimations column group.
DRAM Write Traffic
Description: Total estimated data written to the DRAM memory.
Collected during the Trip Counts (Characterization) and Performance Modeling analyses in the Offload Modeling perspective and found in the Accelerated Regions tab > Code Regions pane > Memory Estimations column group.
Prerequisites for collection:
- GUI: From the Analysis Workflow pane, enable the Cache Simulation checkbox.
- CLI: Run the --collect=tripcounts action with the --enable-cache-simulation and --target-device=<device> action options.
Prerequisites for display: Expand the Memory Estimations column group.
E
Elapsed Time
Description: Wall-clock time from beginning to end of computing task execution.
Collected during the Survey analysis in the GPU Roofline Insights perspective and found in the GPU Roofline Regions tab > GPU Kernels pane.
EM Active
Description: Average percentage of time when an extended math (EM) pipeline is processed. This metric is available for code running on the Intel® Arc™ graphics code-named Alchemist or newer.
Collected during the Survey analysis in the GPU Roofline Insights perspective and found in the GPU Roofline Regions tab > GPU Kernels pane > XVE Instructions column group.
Estimated Data Transfer with Reuse
Description: Summary of data read from a target platform and written to the target platform. If you enabled the data reuse analysis for the Performance Modeling, the metric value is calculated considering data reuse between code regions on the target platform.
Collected during the Characterization analysis with Trip Counts in the Offload Modeling perspective and found in the Accelerated Regions tab > Code Regions pane.
Prerequisites for collection:
- GUI: From the Analysis Workflow pane, set the Data Transfer Simulation to Light, Medium, or Full.
- CLI: Run the --collect=tripcounts action with the --data-transfer=[full | medium | light] action options.
Estimated Time on Device
Description: Estimated elapsed wall-clock time from beginning to end of loop execution estimated on a target platform after offloading without offload overhead and time for non-offloaded code.
Collected during the Performance Modeling analysis in the Offload Modeling perspective and found in the Accelerated Regions tab > Code Regions pane > Basic Estimated Metrics column group.
Prerequisite for display: Expand the Basic Estimated Metrics column group.
EU Threading Occupancy
Description: Percentage of cycles on all execution units (EU) and thread slots when a slot has a thread scheduled.
Collected during the Survey analysis in the GPU Roofline Insights perspective and found in the GPU Roofline Regions tab > GPU Kernels pane.
F
Fill Count per Thread
Description: Number of fill instructions used to read data values spilled from GRF into memory (L3 cache).
Collected during the Characterization analysis with Trip Counts and GPU profiling in the GPU Roofline Insights perspective and found in the GPU Roofline Regions tab > GPU Kernels pane > Register Spilling column group.
Prerequisites for display: Expand the Register Spilling column group.
Interpretation: A high number of memory spill/fill (or load/store) operations significantly increases memory traffic and decreases the performance.
FLOAT Operations
Description: Summary of floating-point operations in a kernel.
Collected during the Characterization analysis with GPU profiling in the GPU Roofline Insights perspective and found in the GPU Roofline Regions tab > GPU Kernels pane > GPU Compute Performance column group.
Aggregation:
- GOp - Number of giga floating-point operations.
- GOp/s - Number of giga floating-point operations per second.
- AI - Ratio of floating-point operations to the bytes transferred to GPU memory.
You can hover over each value in the cell to see the value description.
FLOP AI (Global Memory)
Description: Estimated arithmetic intensity for floating-point operations (FLOP), in operations per byte.
Collected during the Performance Modeling analysis in the Offload Modeling perspective and found in the Accelerated Regions tab > Code Regions pane > Estimated FLOAT Operations column group.
Calculated as ratio of floating-point operations to total bytes transferred to global memory (DRAM, HBM, or GDDR6).
FP AI
Description: Ratio of floating-point operations to bytes transferred to GPU memory.
Collected during the Characterization analysis with GPU profiling in the GPU Roofline Insights perspective and found in the GPU Roofline Regions tab > GPU Kernels pane > GPU Compute Performance column group.
Prerequisites for display: Expand the GPU Compute Performance column group. This metric is also shown in the collapsed FLOAT Operations column.
FPU Active
Description: Average percentage of time when an floating-point unit (FPU) pipeline is processed. This metric is available for code running on the Intel® Arc™ graphics code-named Alchemist or newer.
Collected during the Survey analysis in the GPU Roofline Insights perspective and found in the GPU Roofline Regions tab > GPU Kernels pane > XVE Instructions column group.
FPU and EM Active
Description: Average percentage of time when floating-point unit (FPU) and extended math (EM) unit pipelines are processed. This metric is available for code running on the Intel® Arc™ graphics code-named Alchemist or newer.
Collected during the Survey analysis in the GPU Roofline Insights perspective and found in the GPU Roofline Regions tab > GPU Kernels pane > XVE Instructions column group.
FPU and Matrix Engine Active
Description: Average percentage of time when floating-point unit (FPU) and matrix engine pipelines are processed. This metric is available for code running on the Intel® Arc™ graphics code-named Alchemist or newer.
Collected during the Survey analysis in the GPU Roofline Insights perspective and found in the GPU Roofline Regions tab > GPU Kernels pane > XVE Instructions column group.
Fraction of Offloads
Description: Percentage of time spent in code regions profitable for offloading in relation to the total execution time of the region.
Collected during the Performance Modeling analysis in the Offload Modeling perspective and found in the Accelerated Regions tab > Code Regions pane > Basic Estimated Metrics column group.
Prerequisites for display: Expand the Basic Estimated Metrics column group.
Interpretation: 100% means there are no non-offloaded child regions, calls to parallel runtime libraries, or system calls in the region.
From Target
Description: Estimated data transferred from a target platform to a shared memory by a loop, in megabytes. If you enabled the data reuse analysis for the Performance Modeling, the metric value is calculated considering data reuse between code regions on a target platform.
Collected during the Characterization analysis with Trip Counts in the Offload Modeling perspective and found in the Accelerated Regions tab > Code Regions pane > Estimated Data Transfer with Reuse column group.
Prerequisites for collection:
- GUI: From the Analysis Workflow pane, set the Data Transfer Simulation to Light, Medium, or Full.
- CLI: Run the --collect=tripcounts action with the --data-transfer=[full | medium | light] action options.
Prerequisite for display: Expand the Estimated Data Transfer with Reuse column group.
G
- GFLOP (GPU Roofline)
- GFLOP (Offload Modeling)
- GFLOP32
- GFLOP64
- GFLOPS (GPU Roofline)
- GFLOPS (Offload Modeling)
- GFLOPS32
- GFLOPS64
- GINT32
- GINT64
- GINTOP (GPU Roofline)
- GINTOP (Offload Modeling)
- GINTOPS (GPU Roofline)
- GINTOPS (Offload Modeling)
- GINTOPS32
- GINTOPS64
- Global
- Global Size (Compute Estimates)
- Global Size (Measured)
- GPU Memory
- GPU Shader Atomics
- GPU Shader Barriers
- GTI
- GTI BW (Estimated Bounded By)
- GTI BW (Memory Estimations)
- GTI BW Utilization
- GTI Read Traffic
- GTI Traffic
- GTI Write Traffic
GFLOP (GPU Roofline)
Description: Number of giga floating-point operations.
Collected during the Characterization analysis with GPU profiling in the GPU Roofline Insights perspective and found in the GPU Roofline Regions tab > GPU Kernels pane > GPU Compute Performance column group.
Instruction types counted: BASIC COMPUTE, FMA, BIT, DIV, POW, MATH.
Prerequisites for display: Expand the GPU Compute Performance column group. This metric is also shown in the collapsed FLOAT Operations column.
GFLOP (Offload Modeling)
Description: Estimated number of giga floating-point operations.
Collected during the Performance Modeling analysis in the Offload Modeling perspective and found in the Accelerated Regions tab > Code Regions pane > Estimated FLOAT Operations column group.
GFLOP32
Description: Estimated number of 32-bit giga floating-point operations.
Collected during the Performance Modeling analysis in the Offload Modeling perspective and found in the Accelerated Regions tab > Code Regions pane > Estimated FLOAT Operations column group.
Prerequisites for display: Expand the Estimated FLOAT Operations column group.
GFLOP64
Description: Estimated number of 64-bit giga floating-point operations.
Collected during the Performance Modeling analysis in the Offload Modeling perspective and found in the Accelerated Regions tab > Code Regions pane > Estimated FLOAT Operations column group.
Prerequisites for display: Expand the Estimated FLOAT Operations column group.
GFLOPS (GPU Roofline)
Description: Number of giga floating-point operations per second.
Collected during the Characterization analysis with GPU profiling in the GPU Roofline Insights perspective and found in the GPU Roofline Regions tab > GPU Kernels pane > GPU Compute Performance column group.
Instruction types counted: BASIC COMPUTE, FMA, BIT, DIV, POW, MATH.
Prerequisites for display: Expand the GPU Compute Performance column group. This metric is also shown in the collapsed FLOAT Operations column.
GFLOPS (Offload Modeling)
Description: Estimated number of giga floating-point operations per second.
Collected during the Performance Modeling analysis in the Offload Modeling perspective and found in the Accelerated Regions tab > Code Regions pane > Estimated FLOAT Operations column group.
GFLOPS32
Description: Estimated number of 32-bit giga floating-point operations per second.
Collected during the Performance Modeling analysis in the Offload Modeling perspective and found in the Accelerated Regions tab > Code Regions pane > Estimated FLOAT Operations column group.
Prerequisites for display: Expand the Estimated FLOAT Operations column group.
GFLOPS64
Description: Estimated number of 64-bit giga floating-point operations per second.
Collected during the Performance Modeling analysis in the Offload Modeling perspective and found in the Accelerated Regions tab > Code Regions pane > Estimated FLOAT Operations column group.
Prerequisites for display: Expand the Estimated FLOAT Operations column group.
GINT32
Description: Estimated number of 32-bit giga integer operations.
Collected during the Performance Modeling analysis in the Offload Modeling perspective and found in the Accelerated Regions tab > Code Regions pane > Estimated INT Operations column group.
Prerequisites for display: Expand the Estimated INT Operations column group.
GINT64
Description: Estimated number of 64-bit giga integer operations.
Collected during the Performance Modeling analysis in the Offload Modeling perspective and found in the Accelerated Regions tab > Code Regions pane > Estimated INT Operations column group.
Prerequisites for display: Expand the Estimated INT Operations column group.
GINTOP (GPU Roofline)
Description: Number of giga integer operations.
Collected during the Characterization analysis with GPU profiling in the GPU Roofline Insights perspective and found in the GPU Roofline Regions tab > GPU Kernels pane > GPU Compute Performance column group.
Instruction types counted: BASIC COMPUTE, FMA, BIT, DIV, POW, MATH.
Prerequisites for display: Expand the GPU Compute Performance column group. This metric is also shown in the collapsed INT Operations column.
GINTOP (Offload Modeling)
Description: Estimated number of giga integer operations.
Collected during the Performance Modeling analysis enabled in the Offload Modeling perspective and found in the Accelerated Regions tab > Code Regions pane > Estimated INT Operations column group.
GINTOPS (GPU Roofline)
Description: Number of giga integer operations per second.
Collected during the Characterization analysis with GPU profiling in the GPU Roofline Insights perspective and found in the GPU Roofline Regions tab > GPU Kernels pane > GPU Compute Performance column group.
Instruction types counted: BASIC COMPUTE, FMA, BIT, DIV, POW, MATH.
Prerequisites for display: Expand the GPU Compute Performance column group. This metric is also shown in the collapsed INT Operations column.
GINTOPS (Offload Modeling)
Description: Estimated number of giga integer operations per second.
Collected during the Performance Modeling analysis in the Offload Modeling perspective and found in the Accelerated Regions tab > Code Regions pane > Estimated INT Operations column group.
GINTOPS32
Description: Estimated number of 32-bit giga integer operations per second.
Collected during the Performance Modeling analysis in the Offload Modeling perspective and found in the Accelerated Regions tab > Code Regions pane > Estimated INT Operations column group.
Prerequisite for display: Expand the Estimated INT Operations column group.
GINTOPS64
Description: Estimated number of 64-bit giga integer operations per second.
Collected during the Performance Modeling analysis in the Offload Modeling perspective and found in the Accelerated Regions tab > Code Regions pane > Estimated INT Operations column group.
Prerequisite for display: Expand the Estimated INT Operations column group.
Global
Description: Total number of work items in all work groups.
Collected during the Survey analysis in the GPU Roofline Insights perspective and found in the GPU Roofline Regions tab > GPU Kernels pane > Work Size column group.
Global Size (Compute Estimates)
Description: Total estimated number of work items in a loop executed after offloaded on a target platform.
Collected during the Characterization analysis with Trip Counts and Performance Modeling analysis in the Offload Modeling perspective and found in the Accelerated Regions tab > Code Regions pane > Compute Estimates column group.
Prerequisite for display: Expand the Compute Estimates column group.
Global Size (Measured)
Description: Total number of work items in a kernel instance on a baseline device. This metric is only available for the GPU-to-GPU modeling.
Collected during the Survey analysis with enabled GPU profiling in the Offload Modeling perspective and found in the Accelerated Regions tab > Code Regions pane > Measured column group.
Prerequisite for display: Expand the Measured column group.
GPU Memory
Description: Summary of GPU memory usage in a kernel. GPU memory is data transferred to and from GPU, chip uncore (LLC), and main memory.
Collected during the Survey analysis in the GPU Roofline Insights perspective and found in the GPU Roofline Regions tab > GPU Kernels pane.
Aggregation: The column reports the following metrics:
- Total GPU memory traffic, in gigabytes
- GPU memory bandwidth, in gigabytes per second
You can hover over each value in the cell to see the value description.
GPU Shader Atomics
Description: Total number of shader atomic memory accesses.
Collected during the Survey analysis in the GPU Roofline Insights perspective and found in the GPU Roofline Regions tab > GPU Kernels pane.
GPU Shader Barriers
Description: Total number of shader barrier messages.
Collected during the Survey analysis in the GPU Roofline Insights perspective and found in the GPU Roofline Regions tab > GPU Kernels pane.
GTI
Description: Summary of estimated GTI memory usage, including GTI bandwidth, in gigabytes per second, and total GTI traffic calculated as sum of read and write traffic.
Collected during the Trip Counts (Characterization) and Performance Modeling analyses in the Offload Modeling perspective and found in the Accelerated Regions tab > Code Regions pane > Memory Estimations column group.
Prerequisites for collection:
- GUI: From the Analysis Workflow pane, enable the Cache Simulation checkbox.
- CLI: Run the --collect=tripcounts action with the --enable-cache-simulation and --target-device=<device> action options.
GTI BW (Estimated Bounded By)
Description: Graphics technology interface (GTI) Bandwidth. Estimated time, in seconds, spent on reading from and writing to GTI memory assuming a maximum GTI memory bandwidth is achieved.
Collected during the Trip Counts analysis (Characterization) and the Performance Modeling analysis in the Offload Modeling perspective and found in the Accelerated Regions tab > Code Regions pane > Estimated Bounded By column group.
Prerequisite for display: Expand the Estimated Bounded By column group.
GTI BW (Memory Estimations)
Description: Graphics technology interface (GTI) Bandwidth. Estimated rate at which data is transferred to and from the GTI, in gigabytes per second.
Collected during the Trip Counts (Characterization) and Performance Modeling analyses in the Offload Modeling perspective and found in the Accelerated Regions tab > Code Regions pane > Memory Estimations column group.
Prerequisites for collection:
- GUI: From the Analysis Workflow pane, enable the Cache Simulation checkbox.
- CLI: Run the --collect=tripcounts action with the --enable-cache-simulation and --target-device=<device> action options.
Prerequisites for display: Expand the Memory Estimations column group.
GTI BW Utilization
Description: Graphics technology interface (GTI) bandwidth utilization. Estimated GTI bandwidth utilization, in per cent.
Collected during the Trip Counts (Characterization) and Performance Modeling analyses in the Offload Modeling perspective and found in the Memory Estimations column group in the Code Regions pane of the Accelerated Regions tab.
Prerequisites for collection:
GUI: From the Analysis Workflow pane, enable the Cache Simulation checkbox.
CLI: Run the --collect=tripcounts action with the --enable-cache-simulation and --target-device=<device> action options.
Prerequisites for display: Expand the Memory Estimations column group.
Calculation: Ratio of average bandwidth to a maximum theoretical bandwidth.
GTI Read Traffic
Description: Total estimated data read from the GTI memory.
Collected during the Trip Counts (Characterization) and Performance Modeling analyses in the Offload Modeling perspective and found in the Accelerated Regions tab > Code Regions pane > Memory Estimations column group.
Prerequisites for collection:
- GUI: From the Analysis Workflow pane, enable the Cache Simulation checkbox.
- CLI: Run the --collect=tripcounts action with the --enable-cache-simulation and --target-device=<device> action options.
Prerequisites for display: Expand the Memory Estimations column group.
GTI Traffic
Description: Estimated sum of data read from and written to the GTI memory.
Collected during the Trip Counts (Characterization) and Performance Modeling analyses in the Offload Modeling perspective and found in the Accelerated Regions tab > Code Regions pane > Memory Estimations column group.
Prerequisites for collection:
- GUI: From the Analysis Workflow pane, enable the Cache Simulation checkbox.
- CLI: Run the --collect=tripcounts action with the --enable-cache-simulation and --target-device=<device> action options.
Prerequisites for display: Expand the Memory Estimations column group.
GTI Write Traffic
Description: Total estimated data written to the GTI memory.
Collected during the Trip Counts (Characterization) and Performance Modeling analyses in the Offload Modeling perspective and found in the Accelerated Regions tab > Code Regions pane > Memory Estimations column group.
Prerequisites for collection:
- GUI: From the Analysis Workflow pane, enable the Cache Simulation checkbox.
- CLI: Run the --collect=tripcounts action with the --enable-cache-simulation and --target-device=<device> action options.
Prerequisites for display: Expand the Memory Estimations column group.
Hardware Events per SEND
Description: Average number of atomic accesses generated by one atomic SEND instruction.
Collected during the Performance Modeling analysis in the Offload Modeling perspective and found in the Accelerated Regions tab > Code Regions pane > Atomics column group.
Prerequisites for display: Expand the Atomics column group.
Host-to-Device Size
Description: Total data transferred from host to device.
Collected during the Characterization analysis with FLOP in the GPU Roofline Insights perspective and found in the GPU Roofline Regions tab > GPU Kernels pane > Data Transferred column group.
Prerequisites for display: Expand the Data Transferred column group.
Host-to-Device Time
Description: Total time spent on transferring data from host to device.
Collected during the Characterization analysis with FLOP in the GPU Roofline Insights perspective and found in the GPU Roofline Regions tab > GPU Kernels pane > Data Transferred column group.
Prerequisites for display: Expand the Data Transferred column group.
I
Idle
Description: Percentage of cycles on all execution units (EU) or vector engines (XVE) when no threads are scheduled on an EU or XVE.
Collected during the Survey analysis in the GPU Roofline Insights perspective and found in the GPU Roofline Regions report > GPU Kernels pane > EU Array column group or GPU Roofline Regions report > GPU Kernels pane > XVE Array column group (for code running on the Intel® Arc™ graphics code-named Alchemist or newer).
Ignored Time
Description: Time spent in system calls and calls to ignored modules or parallel runtime libraries in the code regions recommended for offloading.
Collected during the Performance Modeling analysis in the Offload Modeling perspective and found in the Accelerated Regions tab > Code Regions pane > Non-User Code Metrics column group.
Prerequisites for collection: From CLI, run the --collect=projection action with the --ignore=<code-to-ignore> action option. For example, to ignore MPI and OpenMP* calls, use the flag as follows: --ignore=MPI,OMP.
Prerequisite for display: Expand the Time in Non-User Code column group.
Interpretation: Time in the ignored code parts is not used for the : estimations. It does not affect time estimated for offloaded code regions.
Instances (GPU Roofline)
Description: Total number of times a task executes on a GPU.
Collected during the Survey analysis in the GPU Roofline Insights perspective and found in the GPU Roofline Regions tab > GPU Kernels pane > Kernel Details column group.
Prerequisite for display: Expand the Kernel Details column group.
Instances (Offload Modeling - Compute Estimates)
Description: Total estimated number of times a loop executes on a target platform.
Collected during the Characterization analysis with Trip Counts in the Offload Modeling perspective and found in the Accelerated Regions tab > Code Regions pane > Compute Estimates column group.
Prerequisite for display: Expand the Compute Estimates column group.
Instances (Offload Modeling - Measured)
Description: Total number of times a loop executes on a baseline GPU device.
Collected during the \ Characterization analysis with Trip Counts in the Offload Modeling perspective and found in the Accelerated Regions tab > Code Regions pane > Measured column group.
INT AI (GPU Compute Performance)
Description: Ratio of integer operations to transferred bytes.
Collected during the Characterization with GPU profiling in the GPU Roofline Insights perspective and found in the GPU Roofline Regions report > GPU Kernels pane > GPU Compute Performance column group.
Instruction types counted: BASIC COMPUTE, FMA, BIT, DIV, POW, MATH.
Prerequisites for display: Expand the GPU Compute Performance column group. This metric is also shown in the INT Operations column when the group is collapsed.
INT AI (Global Memory)
Description: Estimated arithmetic intensity for integer operations, in operations per byte.
Collected during the Performance Modeling analysis in the Offload Modeling perspective and found in the Accelerated Regions tab > Code Regions pane > Estimated FLOAT Operations column group.
Calculated as ratio of integer operations to total bytes transferred to global memory (DRAM, HBM, or GDDR6).
INT Operations
Description: Summary of integer operations used in a kernel.
Collected during the Characterization analysis with GPU profiling in the GPU Roofline Insights perspective and found in the GPU Roofline Regions tab > GPU Kernels pane > GPU Compute Performance column group.
Aggregation:
- GOp - Number of giga integer operations.
- GOp/s - Number of giga integer operations per second.
- AI - Ratio of integer operations to the bytes transferred to GPU memory.
You can hover over each value in the cell to see the value description.
IPC Rate
Description: Average rate of instructions per cycle (IPC) calculated for two floating-point unit (FPU) pipelines. For code running on the Intel® Arc™ graphics code-named Alchemist or newer, IPC rate is calculated for extended math (EM) unit and floating-point unit (FPU) pipelines.
Collected during the Survey analysis in the GPU Roofline Insights perspective and found in the GPU Roofline Regions tab > GPU Kernels pane > EU Instructions column group or GPU Roofline Regions tab > GPU Kernels pane > XVE Instructions column group (for code running on the Intel® Arc™ graphics code-named Alchemist or newer).
Iteration Space
Description: Summary of iteration metrics measured on a baseline device.
Collected during the Characterization analysis with Trip Counts (for CPU regions) or the Survey analysis with GPU profiling (for GPU regions) in the Offload Modeling perspective and found in the Accelerated Regions tab > Code Regions pane > Measured column group.
Aggregation: For the CPU-to-GPU modeling, this column reports the following metrics:
- Call Count (CC) - The number of times a loop/function was invoked.
- Trip Counts (TC) - The average number of times a loop/function was executed.
For the GPU-to-GPU modeling, this column reports the following metrics:
J
Kernel
Description: Kernel name.
Collected during the Survey analysis in the GPU Roofline Insights perspective and found in the GPU Roofline Regions tab > GPU Kernels pane.
Kernel Launch Tax
Description: Total estimated time cost for invoking a kernel when offloading a loop to a target platform. Does not include data transfer costs.
Collected during the Performance Modeling analysis in the Offload Modeling perspective and found in the Accelerated Regions tab > Code Regions pane > Estimated Bounded By column group.
Prerequisite for display: Expand the Estimated Bounded By column group.
Kernel Type
Description: Action that a kernel performs.
Collected during the Survey analysis in the GPU Roofline Insights perspective and found in the GPU Roofline Regions tab > GPU Kernels pane.
Possible values:
- Compute
- Transfer
- Transfer in
- Transfer out
- Synchronization
- Allocate memory
L
- Latencies
- L3 BW
- L3 Cache
- L3 Cache BW
- L3 Cache BW Utilization
- L3 Cache Read Traffic
- L3 Cache Traffic
- L3 Cache Write Traffic
- L3 Shader
- LLC
- LLC BW (Estimated Bounded By)
- LLC BW (Memory Estimations)
- LLC BW Utilization
- LLC Read Traffic
- LLC Traffic
- LLC Write Traffic
- Load Latency
- Local
- Local Memory Size
- Local Size (Compute Estimates)
- Local Size (Measured)
- Loop/Function
Latencies
Description: Top uncovered latency in a loop/function, in milliseconds.
Collected during the Performance Modeling analysis in the Offload Modeling perspective and found in the Accelerated Regions tab > Code Regions pane > Estimated Bounded By column group.
L3 BW
Description: L3 Bandwidth. Estimated time, in seconds, spent on reading from L3 cache and writing to L3 cache assuming a maximum L3 cache bandwidth is achieved.
Collected during the Characterization analysis with Trip Counts in the Offload Modeling perspective and found in the Accelerated Regions tab > Code Regions pane > Estimated Bounded By column group.
Prerequisite for display: Expand the Estimated Bounded By column group.
L3 Cache
Description: Summary of estimated L3 cache usage, including L3 cache bandwidth (in gigabytes per second) and L3 cache traffic calculated as sum of read and write traffic.
Collected during the Characterization analysis with Trip Counts and Performance Modeling analysis in the Offload Modeling perspective and found in the Accelerated Regions tab > Code Regions pane > Memory Estimations column group.
Prerequisites for collection:
- GUI: From the Analysis Workflow pane, enable the Cache Simulation checkbox.
- CLI: Run the --collect=tripcounts action with the --enable-cache-simulation and --target-device=<device> action options.
L3 Cache BW
Description: Average estimated rate at which data is transferred to and from the L3 cache, in gigabytes per second.
Collected during the Characterization analysis with Trip Counts and Performance Modeling analysis in the Offload Modeling perspective and found in the Accelerated Regions tab > Code Regions pane > Memory Estimations column group.
Prerequisites for collection:
- GUI: From the Analysis Workflow pane, enable the Cache Simulation checkbox.
- CLI: Run the --collect=tripcounts action with the --enable-cache-simulation and --target-device=<device> action options.
Prerequisites for display: Expand the Memory Estimations column group.
L3 Cache BW Utilization
Description: Estimated L3 cache bandwidth utilization, in per cent, calculated as ratio of average bandwidth to a maximum theoretical bandwidth.
Collected during the Characterization analysis with Trip Counts and Performance Modeling analysis in the Offload Modeling perspective and found in the Accelerated Regions tab > Code Regions pane > Memory Estimations column group.
Prerequisites for collection:
- GUI: From the Analysis Workflow pane, enable the Cache Simulation checkbox.
- CLI: Run the --collect=tripcounts action with the --enable-cache-simulation and --target-device=<device> action options.
Prerequisites for display: Expand the Memory Estimations column group.
L3 Cache Read Traffic
Description: Total estimated data read from the L3 cache.
Collected during the Characterization analysis with Trip Counts and Performance Modeling analysis in the Offload Modeling perspective and found in the Accelerated Regions tab > Code Regions pane > Memory Estimations column group.
Prerequisites for collection:
- GUI: From the Analysis Workflow pane, enable the Cache Simulation checkbox.
- CLI: Run the --collect=tripcounts action with the --enable-cache-simulation and --target-device=<device> action options.
Prerequisites for display: Expand the Memory Estimations column group.
L3 Cache Traffic
Description: Estimated sum of data read from and written to the L3 cache.
Collected during the Characterization analysis with Trip Counts and Performance Modeling analysis in the Offload Modeling perspective and found in the Accelerated Regions tab > Code Regions pane > Memory Estimations column group.
Prerequisites for collection:
- GUI: From the Analysis Workflow pane, enable the Cache Simulation checkbox.
- CLI: Run the --collect=tripcounts action with the --enable-cache-simulation and --target-device=<device> action options.
Prerequisites for display: Expand the Memory Estimations column group.
L3 Cache Write Traffic
Description: Total estimated data written to the L3 cache.
Collected during the Characterization analysis with Trip Counts and Performance Modeling analysis in the Offload Modeling perspective and found in the Accelerated Regions tab > Code Regions pane > Memory Estimations column group.
Prerequisites for collection:
- GUI: From the Analysis Workflow pane, enable the Cache Simulation checkbox.
- CLI: Run the --collect=tripcounts action with the --enable-cache-simulation and --target-device=<device> action options.
Prerequisites for display: Expand the Memory Estimations column group.
L3 Shader
Description: Summary of L3 cache usage in a kernel.
Collected during the Survey analysis in the GPU Roofline Insights perspective and found in the GPU Roofline Regions tab > GPU Kernels pane.
Aggregation: The column reports the following metrics:
- Total L3 traffic, in gigabytes
- L3 bandwidth, in gigabytes per second
- Cache line utilization, in per cent. This metric is shown only if CARM is collected. If the kernel uses only a small portion of the transferred bytes, the value is highlighted in red.
You can hover over each value in the cell to see the value description and interpretation hints.
LLC
Description: Estimated last-level cache (LLC) usage, including LLC cache bandwidth (in gigabytes per second) and total LLC cache traffic, which is a sum of read and write traffic.
Collected during the Characterization analysis with Trip Counts and Performance Modeling analysis in the Offload Modeling perspective and found in the Accelerated Regions tab > Code Regions pane > Memory Estimations column group.
Prerequisites for collection:
- GUI: From the Analysis Workflow pane, enable the Cache Simulation checkbox.
- CLI: Run the --collect=tripcounts action with the --enable-cache-simulation and --target-device=<device> action options.
LLC BW (Estimated Bounded By)
Description: Last-level cache (LLC) bandwidth. Estimated time, in seconds, spent on reading from LLC and writing to LLC assuming a maximum LLC bandwidth is achieved.
Collected during the Characterization analysis with Trip Counts in the Offload Modeling perspective and found in the Accelerated Regions tab > Code Regions pane > Estimated Bounded By column group.
Prerequisite for display: Expand the Estimated Bounded By column group.
LLC BW (Memory Estimations)
Description: Estimated rate at which data is transferred to and from the LLC cache, in gigabytes per second.
Collected during the Characterization analysis with Trip Counts and Performance Modeling analysis in the Offload Modeling perspective and found in the Accelerated Regions tab > Code Regions pane > Memory Estimations column group.
Prerequisites for collection:
- GUI: From the Analysis Workflow pane, enable the Cache Simulation checkbox.
- CLI: Run the --collect=tripcounts action with the --enable-cache-simulation and --target-device=<device> action options.
Prerequisites for display: Expand the Memory Estimations column group.
LLC BW Utilization
Description: Estimated LLC cache bandwidth utilization, in per cent.
Collected during the Characterization analysis with Trip Counts and Performance Modeling analysis in the Offload Modeling perspective and found in the Accelerated Regions tab > Code Regions pane > Memory Estimations column group.
Prerequisites for collection:
GUI: From the Analysis Workflow pane, enable the Cache Simulation checkbox.
CLI: Run the --collect=tripcounts action with the --enable-cache-simulation and --target-device=<device> action options.
Prerequisites for display: Expand the Memory Estimations column group.
Calculation: Ratio of average bandwidth to a maximum theoretical bandwidth.
LLC Read Traffic
Description: Total estimated data read from the LLC cache.
Collected during the Characterization analysis with Trip Counts and Performance Modeling analysis in the Offload Modeling perspective and found in the Accelerated Regions tab > Code Regions pane > Memory Estimations column group.
Prerequisites for collection:
- GUI: From the Analysis Workflow pane, enable the Cache Simulation checkbox.
- CLI: Run the --collect=tripcounts action with the --enable-cache-simulation and --target-device=<device> action options.
Prerequisites for display: Expand the Memory Estimations column group.
LLC Traffic
Description: Estimated sum of data read from and written to the LLC cache.
Collected during the Characterization analysis with Trip Counts and Performance Modeling analysis in the Offload Modeling perspective and found in the Accelerated Regions tab > Code Regions pane > Memory Estimations column group.
Prerequisites for collection:
- GUI: From the Analysis Workflow pane, enable the Cache Simulation checkbox.
- CLI: Run the --collect=tripcounts action with the --enable-cache-simulation and --target-device=<device> action options.
Prerequisites for display: Expand the Memory Estimations column group.
LLC Write Traffic
Description: Total estimated data written to the LLC cache.
Collected during the Characterization analysis with Trip Counts and Performance Modeling analysis in the Offload Modeling perspective and found in the Accelerated Regions tab > Code Regions pane > Memory Estimations column group.
Prerequisites for collection:
- GUI: From the Analysis Workflow pane, enable the Cache Simulation checkbox.
- CLI: Run the --collect=tripcounts action with the --enable-cache-simulation and --target-device=<device> action options.
Prerequisites for display: Expand the Memory Estimations column group.
Load Latency
Description: Uncovered cache or memory load latencies uncovered in a code region, in milliseconds.
Collected during the Performance Modeling analysis in the Offload Modeling perspective and found in the Accelerated Regions tab > Code Regions pane > Estimated Bounded By column group.
Prerequisite for display: Estimated Bounded By column group.
Local
Description: Number of work items in one work group.
Collected during the Survey analysis in the GPU Roofline Insights perspective and found in the GPU Roofline Regions report > GPU Kernels pane > Work Size column group.
Local Memory Size
Description: Local memory size used by each thread group.
Collected during the Survey analysis in the GPU Roofline Insights perspective and found in the GPU Roofline Regions tab > GPU Kernels pane > Kernel Details column group.
Prerequisite for display: Expand the Kernel Details column group.
Local Size (Compute Estimates)
Description: Total estimated number of work items in one work group of a loop executed after offloaded on a target platform.
Collected during the Characterization analysis with Trip Counts in the Offload Modeling perspective and found in the Accelerated Regions tab > Code Regions pane > Compute Estimates column group.
Prerequisite for display: Expand the Compute Estimates column group.
Local Size (Measured)
Description: Total number of work items in one work group of a kernel. This metric is only available for the GPU-to-GPU modeling.
Collected during the Survey analysis with enabled GPU profiling in the Offload Modeling perspective and found in the Accelerated Regions tab > Code Regions pane > Measured column group.
Prerequisite for display: Expand the Measured column group.
Loop/Function
Description: Name and source location of a loop/function in a region, where region is a sub-tree of loops/functions in a call tree.
Collected during the Survey analysis in the Offload Modeling perspective and found in the Accelerated Regions tab > Code Regions pane.
Matrix Engine Active
Description: Average percentage of time when a matrix engine pipeline is processed. This metric is available for code running on the Intel® Arc™ graphics code-named Alchemist or newer.
Collected during the Survey analysis in the GPU Roofline Insights perspective and found in the GPU Roofline Regions tab > GPU Kernels pane > XVE Instructions column group.
Memory Footprint, B
Description: Size of unique data (variables) spilled from general register file (GRF) per thread, in bytes.
Collected during the Characterization analysis with Trip Counts and GPU profiling in the GPU Roofline Insights perspective and found in the GPU Roofline Regions tab > GPU Kernels pane > Register Spilling column group.
Prerequisites for display: Expand the Register Spilling column group. This metric is also shown in the collapsed Register Spilling column.
Interpretation: Higher value indicates that register spilling decreases performance.
Memory Impact
Description: Total memory traffic between general register file (GRF) and L3 caused by the register spilling, in percentage of total traffic.
Collected during the Characterization analysis with Trip Counts and GPU profiling in the GPU Roofline Insights perspective and found in the GPU Roofline Regions tab > GPU Kernels pane > Register Spilling column group.
Prerequisites for display: Expand the Register Spilling column group.
Interpretation: The lower the ratio is, the better the kernel is optimized. If you see a high value, it means that spill/fill traffic takes up a big part of total traffic and may significantly decrease kernel performance.
Calculation: Ratio of total spill/fill traffic to the total observed cache traffic.
Module
Description: Program module name.
Collected during the Survey in the Offload Modeling perspective and found in the Accelerated Regions tab > Code Regions pane > Location column group.
Prerequisites for display: Expand the Location column group.
N
Offload Tax
Description: Total time spent for transferring data and launching kernel, in milliseconds.
Collected during the Performance Modeling analysis in the Offload Modeling perspective and found in the Accelerated Regions tab > Code Regions pane > Estimated Bounded By column group.
Prerequisite for display: Expand the Estimated Bounded By column group.
Offload Summary
Description: Conclusion that indicates whether a code region is profitable for offloading to a target platform. In the Top-Down pane, it also reports the node position, such as offload child loops and child functions.
Collected during the Performance Modeling analysis in the Offload Modeling perspective and found in the Accelerated Regions tab > Code Regions pane > Basic Estimated Metrics column group.
Overall Non-Accelerable Time
Description: Total estimated time spent in non-offloaded parts of offloaded code regions.
Collected during the Survey and Performance Modeling analysis in the Offload Modeling perspective and found in the Accelerated Regions tab > Code Regions pane > Time in Non-User Code column group.
Calculation: This column is a sum of the following metrics:
- Total Time in DAAL Calls
- Total Time in DPC++ Calls
- Total Time in MPI Calls
- Total Time in OpenCL Calls
- Total Time in OpenMP Calls
- Total Time in System Calls
- Total Time in TBB Calls
Interpretation: These code parts are located inside offloaded regions, but the performance model assumes these parts are executed on a baseline device. Examples of such code parts are OpenMP* code parts, Data Parallel C++ (DPC++) runtimes, and system calls.
P
Parallel Factor
Description: Number of loop iterations or kernel work items executed in parallel on a target device for a loop/function.
Collected during the Performance Modeling analysis in the Offload Modeling perspective and found in the Accelerated Regions tab > Code Regions pane > Compute Estimates column group.
Parallel Threads
Description: Estimated number of threads scheduled simultaneously on all execution units (EU) or vector engines (XVE).
Collected during the Performance Modeling analysis in the Offload Modeling perspective andfound in the Accelerated Regions tab > Code Regions pane > Compute Estimates column group.
Prerequisites for display: Expand the Compute Estimates column group.
Performance Issues (GPU Roofline)
Description: Performance issues and recommendations for optimizing code regions executed on a GPU.
Collected during the Survey, Characterization, and Performance Modeling analyses in the GPU Roofline Insights perspective and found in the GPU Roofline Regions tab > GPU Kernels pane .
Interpretation: Click to view the full recommendation text with code examples and recommended fixes in the Recommendations pane of the GPU Roofline Regions tab.
Performance Issues (Offload Modeling)
Description: Recommendations for offloading code regions with estimated performance summary and/or potential issues with optimization hints.
Collected during the Performance Modeling analysis in the Offload Modeling perspective and found in the Accelerated Regions tab > Code Regions pane.
Interpretation: Click to view the full recommendation text with examples of using DPC++ and OpenMP* programming modeling to offload the code regions and/or fix the performance issue in the Recommendations pane of the Accelerated Regions tab.
Private
Description: Total estimated data transferred to a private memory from a target platform by a loop. If you enabled the data reuse analysis for the Performance Modeling, the metric value is calculated considering data reuse between code regions on a target platform.
Collected during the Characterization analysis with Trip Counts in the Offload Modeling perspective and found in the Accelerated Regions tab > Code Regions pane > Estimated Data Transfers with Reuse column group.
Prerequisite for collection:
- GUI: From the Analysis Workflow pane, set the Data Transfer Simulation to Light, Medium, or Full.
- CLI: Run the --collect=tripcounts action with the --data-transfer=[full | medium | light] action options.
Prerequisite for display: Expand the Estimated Data Transfers with Reuse column group.
Private Memory Size
Description: Private memory size allocated by a compiler to each thread.
Collected during the Survey analysis in the GPU Roofline Insights perspective and found in the GPU Roofline Regions tab > GPU Kernels pane > Kernel Details column group.
Prerequisite for display: Expand the Kernel Details column group.
Q
R
Read
Description: Estimated data read from a target platform by an offload region, in megabytes. If you enabled the data reuse analysis for the Performance Modeling, the metric value is calculated considering data reuse between code regions on a target platform.
Collected during the Characterization analysis with Trip Counts analysis in the Offload Modeling perspective and found in the Accelerated Regions tab > Code Regions pane > Estimated Data Transfers with Reuse column group.
Prerequisite for collection:
- GUI: From the Analysis Workflow pane, set the Data Transfer Simulation to Light, Medium, or Full.
- CLI: Run the --collect=tripcounts action with the --data-transfer=[full | medium | light] action options.
Prerequisite for display: Expand the Estimated Data Transfers with Reuse column group.
Read, GB (GPU Memory)
Description: Total data read from GPU, chip uncore (LLC), and main memory, in gigabytes.
Collected during the Survey analysis in the GPU Roofline Insights perspective and found in the GPU Roofline Regions tab > GPU Kernels pane > GPU Memory column group.
Prerequisites for display: Expand the GPU Memory column group.
Read, GB (Register Spilling)
Description: Total data read, or filled, from L3 memory due to register spilling, in gigabytes.
Collected during the Characterization analysis with Trip Counts and GPU profiling in the GPU Roofline Insights perspective and found in the GPU Roofline Regions tab > GPU Kernels pane > Register Spilling column group.
Prerequisites for display: Expand the Register Spilling column group.
Read, GB (SLM)
Description: Total data read from the shared local memory (SLM), in gigabytes.
Collected during the Survey analysis in the GPU Roofline Insights perspective and found in the GPU Roofline Regions tab > GPU Kernels pane > SLM column group.
Prerequisites for display: Expand the SLM column group.
Read, GB/s (GPU Memory)
Description: Rate at which data is read from GPU, chip uncore (LLC), and main memory, in gigabytes per second.
Collected during the Survey analysis in the GPU Roofline Insights perspective and found in the GPU Roofline Regions tab > GPU Kernels pane > GPU Memory column group.
Prerequisites for display: Expand the GPU Memory column group.
Read, GB/s (SLM)
Description: Rate at which data is read from shared local memory (SLM), in gigabytes per second.
Collected during the Survey analysis in the GPU Roofline Insights perspective and found in the GPU Roofline Regions report > GPU Kernels pane > SLM column group.
Prerequisites for display: Expand the SLM column group.
Read without Reuse
Description: Estimated data read from a target platform by a code region considering no data is reused between kernels, in megabytes. This metric is available only if you enabled the data reuse analysis for the Performance Modeling.
Collected during the Characterization analysis with Trip Counts) and Performance Modeling analysis in the Offload Modeling perspective and found in the Accelerated Regions tab > Code Regions pane > Estimated Data Transfers with Reuse column group.
Prerequisite for collection:
- GUI: From the Analysis Workflow pane, set the Data Transfer Simulation under Characterization to Full and enable the Data Reuse Analysis checkbox under Performance Modeling.
- CLI: Use the --data-transfer=full action option with the --collect=tripcounts action and the --data-reuse-analysis option with the --collect=tripcounts and --collect=projection actions.
Prerequisite for display: Expand the Estimated Data Transfers with Reuse column group.
Region
Description: Programming model used in a code region.
Collected during the Survey analysis in the Offload Modeling perspective and found in the Accelerated Regions tab > Code Regions pane > Measured column group.
Register Spilling
Description: Summary of register spilling impact on kernel performance
Collected during the Characterization analysis with Trip Counts and GPU profiling in the GPU Roofline Insights perspective and found in the GPU Roofline Regions tab > GPU Kernels pane.
Interpretation: Register spilling occurs when a thread block (or work item) needs more space in the general register file (GRF) than is available, and data is loaded, or spilled, into memory through L3 cache. Next this data is needed, application has to read, or fill, it from the L3 cache memory, which causes more memory operation. As a result, when register spilling occurs in a kernel, it decreases its performance.
For the best performance, there should be no spills in the kernel.
Aggregation:
- Footprint - Size of unique data (variables) spilled from GRF per thread, in bytes. Higher value indicates register spilling decreases performance.
- Traffic - Total size of data spilled to (spill traffic) and filled from (fill traffic) L3 cache memory due to register spilling, in gigabytes. Higher value indicates register spilling decreases performance.
- Impact (in per cent) - Ratio between total spill/fill traffic and total L3 traffic. It indicates how much traffic is not caused by data exchanged in the kernel algorithm. Higher value indicates register spilling decreases performance.
Repetitions
Description: Average repetitions of atomic SEND instructions.
If a GPU does not support an atomic operation, an additional Compare-And-Swap (CAS) atomic is called. It loads data to a register, operates on it, and compares the result with a previous value. If the values do not match, it means another thread has changed the value, and the current result is invalid. To recalculate, the CAS atomic repeats the process: it loads data, operates on it, and compares. The number of such repetitions on average for atomic SEND instructions is reported in the repetitions metric.
Collected during the Performance Modeling analysis in the Offload Modeling perspective and found in the Accelerated Regions tab > Code Regions pane > Atomics column group.
Prerequisites for display: Expand the Atomics column group.
Calculated as Shader atomics / Expected atomics, where:
- Shader atomics is the number of atomics called in a kernel as measured on a hardware.
Expected atomics is the expected number of atomics called in a kernel without repetitions. It is calculated as Static Atomics * Work Items / Average execution size.
Static atoimcs is the number of atomics defined in a source code. Each static atomic is transformed to an atomic SEND instruction with a certain average execution size, which is the number of elements that the instruction can process in parallel (SIMD model). The ratio of work items to the average execution size is the estimated number of atomic SEND instrictions for one source static atomic.
S
- Send Active
- SIMD Width (GPU Roofline)
- SIMD Width (Offload Modeling - Compute Estimates)
- SIMD Width (Offload Modeling - Measured)
- SLM (GPU Roofline)
- SLM (Offload Modeling)
- SLM BW (Estimated Bounded by)
- SLM BW (Memory Estimations)
- SLM BW Utilization
- SLM Read Traffic
- SLM Traffic
- SLM Write Traffic
- Source Location (GPU Roofline)
- Source Location (Offload Modeling)
- Spill Count per Thread
- Stalled
- SVM Usage Type
- Speed-Up
- Synchronization Time
Send Active
Description: Percentage of cycles on all execution units (EU) or vector engines (XVE) when a send pipeline is actively processed.
Collected during the Survey analysis in the GPU Roofline Insights perspective and found in the GPU Roofline Regions tab > GPU Kernels pane > EU Instructions column group or GPU Roofline Regions tab > GPU Kernels pane > XVE Instructions column group (for code running on the Intel® Arc™ graphics code-named Alchemist or newer).
SIMD Width (GPU Roofline)
Description: Number of work items processed by a single GPU thread.
Collected during the Survey analysis in the GPU Roofline Insights perspective and found in the GPU Roofline Regions report > GPU Kernels pane > Kernel Details column group.
Prerequisites for display: Expand the Kernel Details column group.
SIMD Width (Offload Modeling - Compute Estimates)
Description: Estimated number of work items processed by a single thread on a target platform.
Collected during the Performance Modeling analysis in the Offload Modeling perspective and found in the Accelerated Regions tab > Code Regions pane > Compute Estimates column group.
Prerequisites for display: Expand the Compute Estimates column group.
SIMD Width (Offload Modeling - Measured)
Description: Number of work items processed by a single thread on a baseline device. This metric is only available for the GPU-to-GPU modeling.
Collected during the Survey analysis with enabled GPU profiling analysis in the Offload Modeling perspective and found in the Accelerated Regions tab > Code Regions pane > Measured column group.
Prerequisites for display: Expand the Measured column group.
SLM (GPU Roofline)
Description: Summary of shared local memory (SLM) usage in a kernel.
Collected during the Survey analysis in the GPU Roofline Insights perspective and found in the GPU Roofline Regions tab > GPU Kernels pane.
Aggregation: The column reports the following metrics:
- Total SLM traffic, in gigabytes
- SLM bandwidth, in gigabytes per second
You can hover over each value in the cell to see the value description.
SLM (Offload Modeling)
Description: Summary of estimated SLM usage, including SLM bandwidth, in gigabytes per second, and SLM traffic calculated as sum of read and write traffic.
Collected during the Characterization analysis with Trip Counts and Performance Modeling analysis in the Offload Modeling perspective and found in the Accelerated Regions tab > Code Regions pane > Memory Estimations column group.
SLM BW (Estimated Bounded by)
Description: Shared Local Memory (SLM) bandwidth. Estimated time, in seconds, spent on reading from SLM and writing to SLM assuming a maximum SLM bandwidth is achieved.
Collected during the Characterization analysis with Trip Counts in the Offload Modeling perspective and found in the Accelerated Regions tab > Code Regions pane > Estimated Bounded By column group.
Prerequisite for display: Expand the Estimated Bounded By column group.
SLM BW (Memory Estimations)
Description: Shared Local Memory (SLM) bandwidth. Average estimated rate at which data is transferred to and from the SLM. This is a dynamic value, and depending on the bandwidth value, it can be measured in bytes per second, kilobytes per second, megabytes per second, and so on.
Collected during the Characterization analysis with Trip Counts and Performance Modeling analysis in the Offload Modeling perspective and found in the Accelerated Regions tab > Code Regions pane > Memory Estimations column group.
Prerequisites for display: Expand the Memory Estimations column group.
SLM BW Utilization
Description: Estimated shared local memory (SLM) bandwidth utilization, in per cent.
Collected during the Characterization analysis with Trip Counts and Performance Modeling analysis in the Offload Modeling perspective and found in the Accelerated Regions tab > Code Regions pane > Memory Estimations column group.
Prerequisites for display: Expand the Memory Estimations column group.
Calculation: Ratio of average bandwidth to a maximum theoretical bandwidth.
SLM Read Traffic
Description: Total estimated data read from the SLM.
Collected during the Characterization analysis with Trip Counts and Performance Modeling analysis in the Offload Modeling perspective and found in the Accelerated Regions tab > Code Regions pane > Memory Estimations column group.
Prerequisites for display: Expand the Memory Estimations column group.
SLM Traffic
Description: Estimated sum of data read from and written to the shared local memory (SLM).
Collected during the Characterization analysis with Trip Counts and Performance Modeling analysis in the Offload Modeling perspective and found in the Accelerated Regions tab > Code Regions pane > Memory Estimations column group.
Prerequisites for display: Expand the Memory Estimations column group.
SLM Write Traffic
Description: Total estimated data written to shared local memory (SLM).
Collected during the Characterization analysis with Trip Counts and Performance Modeling analysis in the Offload Modeling perspective and found in the Accelerated Regions tab > Code Regions pane > Memory Estimations column group.
Prerequisites for display: Expand the Memory Estimations column group.
Source Location (Offload Modeling)
Description: Source file name and line number.
Collected during the Survey in the Offload Modeling perspective and found in the Accelerated Regions tab > Code Regions pane > Location column group.
Interpretation: Use this column to understand where a code region is located.
Source Location (GPU Roofline)
Description: Source file name and line number.
Collected during the Survey in the GPU Roofline Insights perspective and found in the GPU Roofline Regions tab > GPU Kernels pane.
Interpretation: Use this column to understand where a kernel is located.
Spill Count per Thread
Description: Number of spill instructions used to load data values from general register file (GRF) into memory (L3 cache).
Collected during the Characterization analysis with Trip Counts and GPU profiling in the GPU Roofline Insights perspective and found in the GPU Roofline Regions tab > GPU Kernels pane > Register Spilling column group.
Prerequisites for display: Expand the Register Spilling column group.
Interpretation: A high number of memory spill/fill (or load/store) operations significantly increases memory traffic and decreases the performance.
Stalled
Description: Percentage of cycles on all execution units (EU) or vector engines (XVE) when at least one thread is scheduled, but the EU or XVE is stalled.
Collected during the Survey analysis in the GPU Roofline Insights perspective and found in the GPU Roofline Regions tab > GPU Kernels pane > EU Array column group or GPU Roofline Regions tab > GPU Kernels pane > XVE Array column group (for code running on the Intel® Arc™ graphics code-named Alchemist or newer).
SVM Usage Type
Collected during the Survey analysis in the GPU Roofline Insights perspective and found in the GPU Roofline Regions tab > GPU Kernels pane > Kernel Details column group.
Prerequisites for display: Expand the Kernel Details column group.
Speed-Up
Description: Estimated speedup for a loop offloaded to a target device, in comparison to the original elapsed time.
Collected during the Performance Modeling analysis in the Offload Modeling perspective and found in the Accelerated Regions tab > Code Regions pane > Basic Estimated Metrics column group.
Interpretation: If the speedup is more than 1, the code region is recommended for offloading to a target device. If the speedup is equal to or less than 1, the code region is not recommended for offloading.
Synchronization Time
Description: Total time spent on synchronization tasks.
Collected during the Characterization analysis in the GPU Roofline Insights perspective and found in the GPU Roofline Regions tab > GPU Kernels pane > Data Transferred column group.
Prerequisites for display: Expand the Data Transferred column group.
T
- Taxes with Reuse
- Thread Occupancy (Compute Estimates)
- Thread Occupancy (Measured)
- Threads per EU
- Throughput
- Time (Estimated)
- Time (Measured)
- Time by DRAM BW
- Time by GTI BW
- Time by L3 Cache BW
- Time by LLC BW
- Time by SLM BW
- To Target
- ToFrom Target
- Total
- Total, GB (GPU Memory)
- Total, GB (L3 Shader)
- Total, GB (SLM)
- Total, GB/s
- Total Size
- Total Time (Data Transferred)
- Total Time (Kernel Details)
- Total Time in DAAL Calls
- Total Time in DPC++ Calls
- Total Time in MPI Calls
- Total Time in OpenCL Calls
- Total Time in OpenMP Calls
- Total Time in System Calls
- Total Time in TBB Calls
- Total Traffic, GB (Register Spilling)
- Total Trip Count
- Total without Reuse
Taxes with Reuse
Description: The highest estimated time cost and a sum of all other costs for offloading a loop from host to a target platform. If you enabled the data reuse analysis for the Performance Modeling, the metric value is calculated considering data reuse between code regions on a target platform. A triangle icon in a table cell indicates that this region reused data.
This decreases the estimates data transfer tax.
Collected during the Characterization analysis with Trip Counts in the Offload Modeling perspective and found in the Accelerated Regions tab > Code Regions pane > Estimated Bounded By column group.
Thread Occupancy (Compute Estimates)
Description: Average percentage of thread slots occupied on all execution units or vector engines estimated on a target device.
Collected during the Performance Modeling analysis in the Offload Modeling perspective and found in the Accelerated Regions tab > Code Regions pane > Compute Estimates column group.
Prerequisites for display: Expand the Compute Estimates column group.
Thread Occupancy (Measured)
Description: Average percentage of thread slots occupied on all execution units or vector engines measured on a baseline device. This metric is only available for the GPU-to-GPU modeling.
Collected during the Survey analysis with GPU profiling in the Offload Modeling perspective and found in the Accelerated Regions tab > Code Regions pane > Measured column group.
Prerequisites for display: Expand the Measured column group.
Threads per EU
Description: Estimated number of threads scheduled simultaneously per execution unit (EU).
Collected during the Performance Modeling analysis in the Offload Modeling perspective and found in the Accelerated Regions tab > Code Regions pane > Compute Estimates column group.
Prerequisites for display: Expand the Compute Estimates column group.
Threads per XVE
Description: Estimated number of threads scheduled simultaneously per vector engine (XVE). This metric is available if you model performance for the Intel® Arc™ graphics code-named Alchemist, which is XeHPG 256 and XeHPG 512 target device configurations in the Intel Advisor, or newer. This metric is equivalent to the Threads per EU metric for legacy terminology.
Collected during the Performance Modeling analysis in the Offload Modeling perspective and found in the Accelerated Regions tab > Code Regions pane > Compute Estimates column group.
Prerequisites for display: Expand the Compute Estimates column group.
Throughput
Description: Top two factors that a loop/function is bounded by, in milliseconds.
Collected during the Performance Modeling analysis in the Offload Modeling perspective and found in the Accelerated Regions tab > Code Regions pane > Estimated Bounded By column group.
Time (Estimated)
Description: Estimated elapsed wall-clock time from beginning to end of loop execution estimated on a target platform after offloading, including offload overhead, with percentage to the total time.
Collected during the Performance Modeling analysis in the Offload Modeling perspective and found in the Accelerated Regions tab > Code Regions pane > Basic Estimated Metrics column group.
Time (Measured)
Description: Elapsed wall-clock time from beginning to end of loop execution measured on a host platform.
Collected during the Survey analysis in the Offload Modeling perspective and found in the Accelerated Regions tab > Code Regions pane > Measured column group.
Time by DRAM BW
Description: Estimated time, in seconds, spent on reading from DRAM memory and writing to DRAM memory assuming a maximum DRAM memory bandwidth is achieved.
Collected during the Characterization analysis with Trip Counts and Performance Modeling analysis in the Offload Modeling perspective and found in the Accelerated Regions tab > Code Regions pane > Memory Estimations column group.
Prerequisites for collection:
- GUI: From the Analysis Workflow pane, enable the Cache Simulation checkbox.
- CLI: Run the --collect=tripcounts action with the --enable-cache-simulation and --target-device=<device> action options.
Prerequisites for display: Expand the Memory Estimations column group.
Time by GTI BW
Description: Estimated time, in seconds, spent on reading from graphics technology interface (GTI) and writing to GTI assuming a maximum GTI bandwidth is achieved.
Collected during the Characterization analysis with Trip Counts and Performance Modeling analysis in the Offload Modeling perspective and found in the Accelerated Regions tab > Code Regions pane > Memory Estimations column group.
Prerequisites for display: Expand the Memory Estimations column group.
Time by L3 Cache BW
Description: Estimated time, in seconds, spent on reading from L3 cache and writing to L3 cache assuming a maximum L3 cache bandwidth is achieved.
Collected during the Characterization analysis with Trip Counts and Performance Modeling analysis in the Offload Modeling perspective and found in the Accelerated Regions tab > Code Regions pane > Memory Estimations column group.
Prerequisites for collection:
- GUI: From the Analysis Workflow pane, enable the Cache Simulation checkbox.
- CLI: Run the --collect=tripcounts action with the --enable-cache-simulation and --target-device=<device> action options.
Prerequisites for display: Expand the Memory Estimations column group.
Time by LLC BW
Description: Estimated time, in seconds, spent on reading from last-level cache (LLC) and writing to LLC assuming a maximum LLC bandwidth is achieved.
Collected during the Characterization analysis with Trip Counts and Performance Modeling analysis in the Offload Modeling perspective and found in the Accelerated Regions tab > Code Regions pane > Memory Estimations column group.
Prerequisites for collection:
- GUI: From the Analysis Workflow pane, enable the Cache Simulation checkbox.
- CLI: Run the --collect=tripcounts action with the --enable-cache-simulation and --target-device=<device> action options.
Prerequisites for display: Expand the Memory Estimations column group.
Time by SLM BW
Description: Estimated time, in seconds, spent on reading from shared local memory (SLM) and writing to SLM assuming a maximum SLM bandwidth is achieved.
Collected during the Characterization analysis with Trip Counts and Performance Modeling analysis in the Offload Modeling perspective and found in the Accelerated Regions tab > Code Regions pane > Memory Estimations column group.
Prerequisites for display: Expand the Memory Estimations column group.
To Target
Description: Estimated data transferred to a target platform from a shared memory by a loop, in megabytes. If you enabled the data reuse analysis for the Performance Modeling, the metric value is calculated considering data reuse between code regions on a target platform.
Collected during the Characterization analysis with Trip Counts in the Offload Modeling perspective and found in the Accelerated Regions tab > Code Regions pane > Estimated Data Transfer with Reuse column group.
Prerequisites for collection:
- GUI: From the Analysis Workflow pane, set the Data Transfer Simulation to Light, Medium, or Full.
- CLI: Run the --collect=tripcounts action with the --data-transfer=[full | medium | light] action options.
Prerequisite for display: Expand the Estimated Data Transfer with Reuse column group.
ToFrom Target
Description: Sum of estimated data transferred both to/from a shared memory to/from a target platform by a loop, in megabytes. If you enabled the data reuse analysis for the Performance Modeling, the metric value is calculated considering data reuse between code regions on a target platform.
Collected during the Characterization analysis with Trip Counts in the Offload Modeling perspective and found in the Accelerated Regions tab > Code Regions pane > Estimated Data Transfer with Reuse column group.
Prerequisites for collection:
- GUI: From the Analysis Workflow pane, set the Data Transfer Simulation to Light, Medium, or Full.
- CLI: Run the --collect=tripcounts action with the --data-transfer=[full | medium | light] action options.
Prerequisite for display: Expand the Estimated Data Transfer with Reuse column group.
Total
Description: Sum of the total estimated traffic incoming to a target platform and the total estimated traffic outgoing from the target platform, for an offload loop, in megabytes.
Collected during the Characterization analysis with Trip Counts in the Offload Modeling perspective and found in the Accelerated Regions tab > Code Regions pane > Estimated Data Transfer with Reuse column group.
Prerequisites for collection:
- GUI: From the Analysis Workflow pane, set the Data Transfer Simulation to Light, Medium, or Full.
- CLI: Run the --collect=tripcounts action with the --data-transfer=[full | medium | light] action options.
Prerequisite for display: Expand the Estimated Data Transfer with Reuse column group.
Calculation: (MappedTo + MappedFrom + 2*MappedToFrom). If you enabled the data reuse analysis for the Performance Modeling, the metric value is calculated considering data reuse between code regions on a target platform.
Total, GB (GPU Memory)
Description: Total data transferred to and from GPU, chip uncore (LLC), and main memory, in gigabytes.
Collected during the Survey analysis in the GPU Roofline Insights perspective and found in the GPU Roofline Regions tab > GPU Kernels pane > GPU Memory column group.
Prerequisite for display: Expand the GPU Memory column. This metric is also shown in the collapsed GPU Memory column.
Total, GB (L3 Shader)
Description: Total data transferred between execution units or vector engines and L3 cache, in gigabytes.
Collected during the Survey analysis in the GPU Roofline Insights perspective and found in the GPU Roofline Regions tab > GPU Kernels pane > L3 Shader column group.
Prerequisites for display: Expand the L3 Shader column. This metric is also shown in the collapsed L3 Shader column.
Total, GB (SLM)
Description: Total data transferred to and from the shared local memory (SLM).
Collected during the Survey analysis in the GPU Roofline Insights perspective and found in the GPU Roofline Regions tab > GPU Kernels pane > SLM column group.
Prerequisites for display: Expand the SLM column. This metric is also shown in the collapsed SLM column.
Total, GB/s
Description: Average data transfer bandwidth between CPU and GPU.
Collected during the Survey analysis in the GPU Roofline Insights perspective and found in the GPU Roofline Regions tab > GPU Kernels pane > Data Transferred column group.
Prerequisites for display: Expand the Data Transferred column group.
Interpretation: In some cases, such as clEnqueueMapBuffer, data transfers might generate high bandwidth because memory is not copied but shared using L3 cache.
Total Size
Description: Total data processed on a GPU.
Collected during the Survey analysis in the GPU Roofline Insights perspective and found in the GPU Roofline Regions tab > GPU Kernels pane > Data Transferred column group.
Total Time (Data Transferred)
Description: Total time for transferring data from host to device and from device to host.
Collected during the Survey analysis in the GPU Roofline Insights perspective and found in the GPU Roofline Regions tab > GPU Kernels pane > Data Transferred column group.
Total Time (Kernel Details)
Description: Total time spent executing a task.
Collected during the Survey analysis in the GPU Roofline Insights perspective and found in the GPU Roofline Regions tab > GPU Kernels pane > Kernel Details column group.
Prerequisites for display: Expand the Kernel Details column group.
Total Time in DAAL Calls
Description: Total time spent in Intel® Data Analytics Acceleration Library (Intel® DAAL) calls in an offloaded code region, in seconds.
Collected during the Survey analysis in the Offload Modeling perspective and found in the Accelerated Regions tab > Code Regions pane > Time in Non-User Code column group.
Prerequisites for display: Expand the Time in Non-User Code column group.
Interpretation: If the value in the column is more than 0, the code region contains Intel DAAL calls.
Total Time in DPC++ Calls
Description: Total time spent in Data Parallel C++ (DPC++) calls in an offloaded code region, in seconds.
Collected during the Survey analysis in the Offload Modeling perspective and found in the Accelerated Regions tab > Code Regions pane > Time in Non-User Code column group.
Prerequisites for display: Expand the Time in Non-User Code column group.
Interpretation: If the value in the column is more than 0, the code region contains DPC++ calls.
Total Time in MPI Calls
Description: Total time spent in MPI calls in an offloaded code region, in seconds.
Collected during the Survey analysis in the Offload Modeling perspective and found in the Accelerated Regions tab > Code Regions pane > Time in Non-User Code column group.
Interpretation: If the value in the column is more than 0, the code region contains MPI calls.
Total Time in OpenCL Calls
Description: Total time spent in OpenCL™ calls in an offloaded code region, in seconds.
Collected during the Survey analysis in the Offload Modeling perspective and found in the Accelerated Regions tab > Code Regions pane > Time in Non-User Code column group.
Prerequisites for display: Expand the Time in Non-User Code column group.
Interpretation: If the value in the column is more than 0, the code region contains OpenCL calls.
Total Time in OpenMP Calls
Description: Total time spent in OpenMP* calls in an offloaded code region, in seconds.
Collected during the Survey analysis in the Offload Modeling perspective and found in the Accelerated Regions tab > Code Regions pane > Time in Non-User Code column group .
Prerequisites for display: Expand the Time in Non-User Code column group.
Interpretation: If the value in the column is more than 0, the code region contains OpenMP calls.
Total Time in System Calls
Description: Total time spent in system calls in an offloaded code region, in seconds.
Collected during the Survey analysis in the Offload Modeling perspective and found in the Accelerated Regions tab > Code Regions pane > Time in Non-User Code column group.
Prerequisites for display: Expand the Time in Non-User Code column group.
Interpretation: If the value in the column is more than 0, the code region contains system calls.
Total Time in TBB Calls
Description: Total time spent in Intel® oneAPI Threading Building Blocks (oneTBB) calls in an offloaded code region, in seconds.
Collected during the Survey analysis in the Offload Modeling perspective and found in the Accelerated Regions tab > Code Regions pane > Time in Non-User Code column group.
Prerequisites for display: Expand the Time in Non-User Code column group.
Interpretation: If the value in the column is more than 0, the code region contains oneTBB calls.
Total Traffic, GB (Register Spilling)
Description: Total data spilled to and filled from L3 memory due to register spilling, in gigabytes.
Collected during the Trip Counts analysis with GPU profiling in the GPU Roofline Insights perspective and found in the GPU Roofline Regions tab > GPU Kernels pane > Register Spilling column group.
Prerequisites for display: Expand the Register Spilling column group.
Interpretation: High value indicates that spill/fill traffic might take a big part of the total data traffic in the kernel and decrease its performance. See the Memory Impact column to understand how much of total traffic it is.
Calculation: A sum of data spilled from general register file (GRF) to L3 and filled from L3 to GRF.
Total Trip Count
Description: Total number of times a loop/function is executed.
Collected during the Characterization analysis with Trip Counts in the Offload Modeling perspective and found in the Accelerated Regions tab > Code Regions pane > Measured column group.
Prerequisites for display: Expand the Measured column group.
Total without Reuse
Description: Sum of the total estimated traffic incoming to a target platform and the total estimated traffic outgoing from the target platform considering no data is reused, in megabytes. This metric is available only if you enabled the data reuse analysis for the Performance Modeling.
Collected during the Characterization analysis with Trip Counts and Performance Modeling analysis in the Offload Modeling perspective and found in the Accelerated Regions tab > Code Regions pane > Estimated Data Transfer with Reuse column group.
Prerequisite for collection:
- GUI: From the Analysis Workflow pane, set the Data Transfer Simulation under Characterization to Full and enable the Data Reuse Analysis checkbox under Performance Modeling.
- CLI: Use the --data-transfer=full action option with the --collect=tripcounts action and the --data-reuse-analysis option with the --collect=tripcounts and --collect=projection actions.
Prerequisite for display: Expand the Estimated Data Transfer with Reuse column group.
Calculation: (MappedTo + MappedFrom + 2*MappedToFrom).
Unroll Factor
Description: Loop unroll factor applied by the compiler.
Collected during the Survey in the Offload Modeling perspective and found in the Accelerated Regions tab > Code Regions pane >Measured column group.
Prerequisites for display: Expand the Measured column group.
Vector ISA
Description: The highest vector instruction set architecture (ISA) used for individual instructions.
Collected during the Survey in the Offload Modeling perspective and found in the Accelerated Regions tab > Code Regions pane > Measured column group.
Prerequisites for display: Expand the Measured column group.
Vector Length
Description: Number of elements processed in a single iteration of vector loops or the number of elements processed in individual vector instructions determined by a binary static analysis or an Intel® Compiler.
Collected during the Survey in the Offload Modeling perspective and found in the Accelerated Regions tab > Code Regions pane > Measured column group.
Prerequisites for display: Expand the Measured column group.
W
Why Not Offloaded
Description: Reason why a code region is not recommended for offloading to a target GPU device.
Collected during the Performance Modeling analysis in the Offload Modeling perspective and found in the Accelerated Regions tab > Code Regions pane > Basic Estimated Metrics column group.
Interpretation: See Investigate Non-Offloaded Code Regions for details about available reasons.
Write
Description: Estimated data written to a target platform by a loop. If you enabled the data reuse analysis for the Performance Modeling, the metric value is calculated considering data reuse between code regions on a target platform.
Collected during the Characterization analysis with Trip Counts in the Offload Modeling perspective and found in the Accelerated Regions tab > Code Regions pane > Estimated Data Transfer with Reuse column group.
Prerequisite for collection:
- GUI: From the Analysis Workflow pane, set the Data Transfer Simulation under Characterization to Light, Medium, or Full.
- CLI: Use the --data-transfer=[full | medium | light] option with the --collect=tripcounts action.
Prerequisite for display: Expand the Estimated Data Transfer with Reuse column group.
Write, GB (GPU Memory)
Description: Total data written to GPU, chip uncore (LLC), and main memory, in gigabytes.
Collected during the Survey analysis in the GPU Roofline Insights perspective and found in the GPU Roofline Regions tab > GPU Kernels pane > GPU Memory column group.
Prerequisites for display: Expand the GPU Memory column group.
Write, GB (Register Spilling)
Description: Total data written, or spilled, to L3 memory due to register spilling, in gigabytes.
Collected during the Characterization analysis with Trip Counts and GPU profiling in the GPU Roofline Insights perspective and found in the GPU Roofline Regions tab > GPU Kernels pane > Register Spilling column group.
Prerequisites for display: Expand the Register Spilling column group.
Write, GB (SLM)
Description: Total data written to the shared local memory (SLM), in gigabytes.
Collected during the Survey analysis in the GPU Roofline Insights perspective and found in the GPU Roofline Regions tab > GPU Kernels pane > SLM column group.
Prerequisites for display: Expand the SLM column group.
Write, GB/s (GPU Memory)
Description: Rate at which data is written to GPU, chip uncore (LLC), and main memory, in gigabytes per second.
Collected during the Survey analysis in the GPU Roofline Insights perspective and found in the GPU Roofline Regions tab > GPU Kernels pane > GPU Memory column group.
Prerequisites for display: Expand the GPU Memory column group.
Write, GB/s (SLM)
Description: Rate at which data is written to shared local memory (SLM), in gigabytes per second.
Collected during the Survey analysis in the GPU Roofline Insights perspective and found in the GPU Roofline Regions tab > GPU Kernels pane > SLM column group.
Prerequisites for display: Expand the SLM column group.
Write without Reuse
Description: Estimated data written to a target platform by a code region considering no data is reused, in megabytes. This metric is available only if you enabled the data reuse analysis for the Performance Modeling.
Collected during the Characterization analysis with Trip Counts and Performance Modeling analysis in the Offload Modeling perspective and found in the Accelerated Regions tab > Code Regions pane > Estimated Data Transfer with Reuse column group.
Prerequisite for collection:
- GUI: From the Analysis Workflow pane, set the Data Transfer Simulation under Characterization to Full and enable the Data Reuse Analysis checkbox under Performance Modeling.
- CLI: Use the --data-transfer=full action option with the --collect=tripcounts action and the --data-reuse-analysis option with the --collect=tripcounts and --collect=projection actions.
Prerequisite for display: Expand the Estimated Data Transfer with Reuse column group.
X, Y, Z
XVE Threading Occupancy
Description: Percentage of cycles on all vector engines (XVE) and thread slots when a slot has a thread scheduled. This metric is available for code running on the Intel® Arc™ graphics code-named Alchemist or newer. This metric is equivalent to the EU Threading Occupancy metric for legacy terminology.
Collected during the Survey analysis in the GPU Roofline Insights perspective and found in the GPU Roofline Regions tab > GPU Kernels pane.