Intel® Advisor provides several methods to run the Offload Modeling perspective from command line. Use one of the following:
- Method 1. Run Offload Modeling with a command line collection presets. Use this method if you want to use basic Intel Advisor analysis and modeling functionality, especially for the first-run analysis. This simple method allows you to run multiple analyses with a single command and control the modeling accuracy.
- Method 2. Run Offload Modeling analyses separately. Use this method if you want to analyze an MPI application or need more advanced analysis customization. This method allows you to select what performance data you want to collect for your application and configure each analysis separately.
- Method 3. Run Offload Modeling with Python* scripts. Use this method if you need more analysis customization. This method is moderately flexible and allows you to customize data collection and performance modeling steps.
Tip
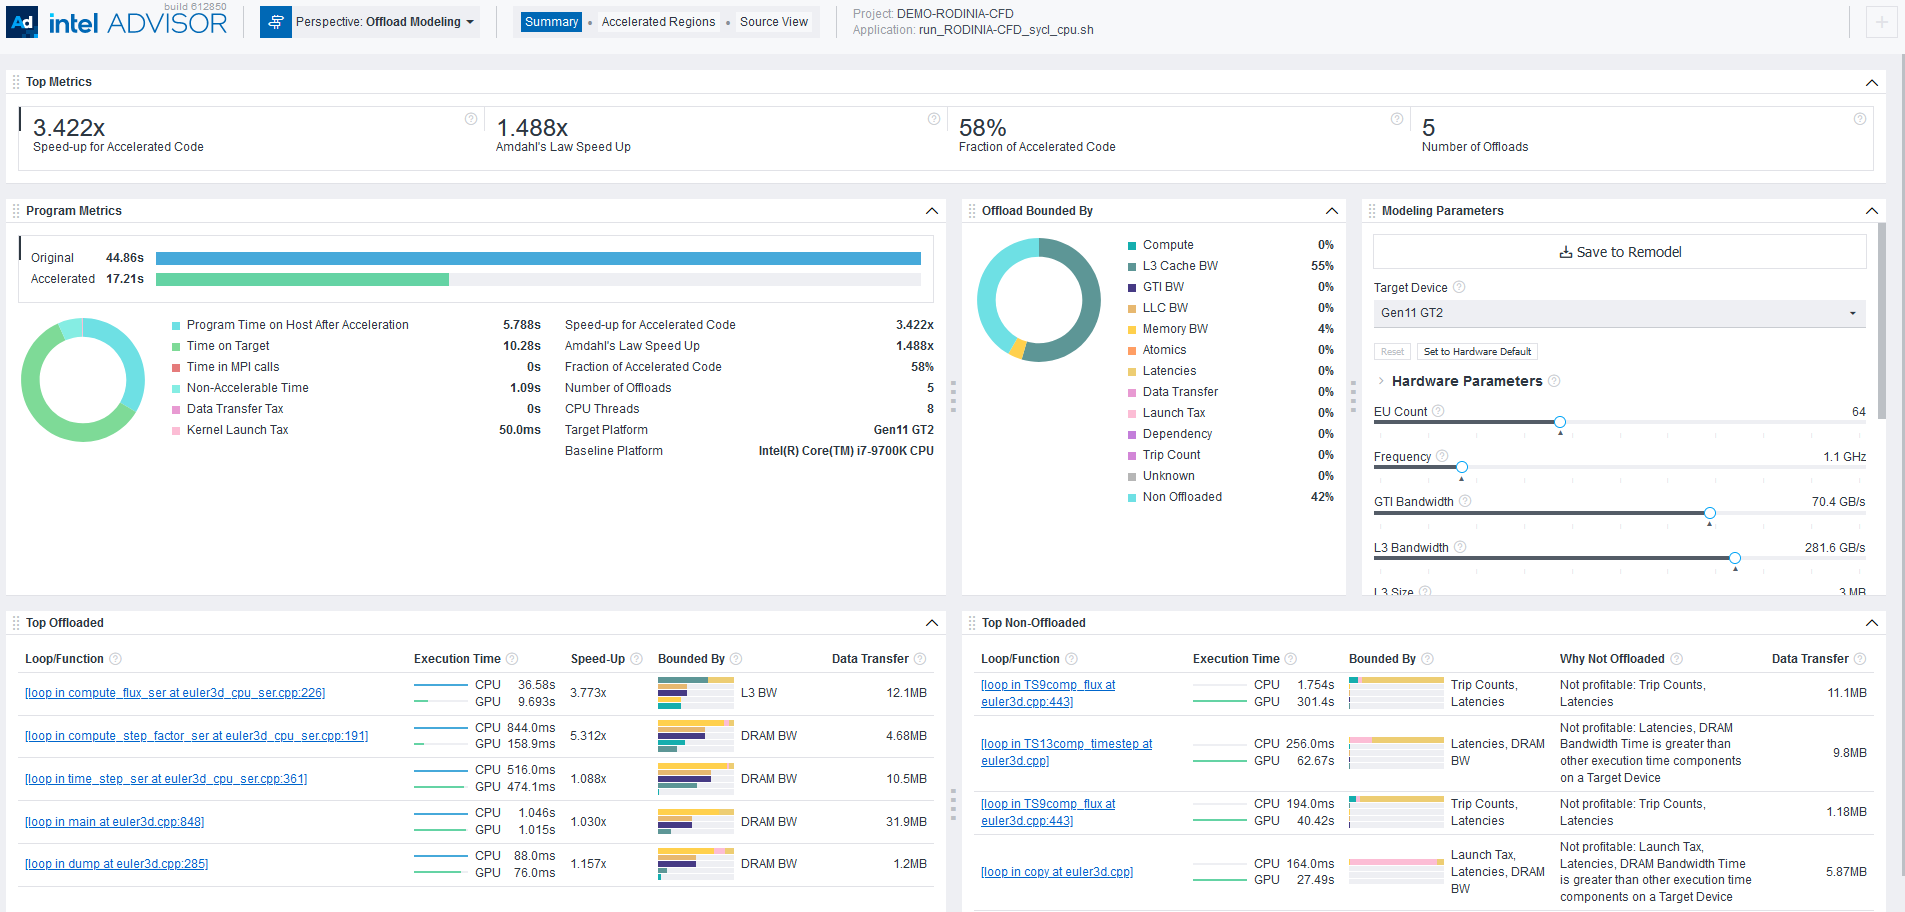
See Intel Advisor cheat sheet for quick reference on command line interface.After you run the Offload Modeling with any method above, you can view the results in Intel Advisor graphical user interface (GUI), command line interface (CLI), or an interactive HTML report. For example, the interactive HTML report is similar to the following:
Prerequisites
- Set
Intel Advisor environment variables with an automated script.
The script enables the advisor command line interface (CLI), advisor-python command line tool, and the APM environment variable, which points to the directory with Offload Modeling scripts and simplifies their use.
- For Data Parallel C++ (DPC++), OpenMP* target, OpenCL™ applications:
Set
Intel Advisor environment variables to offload temporarily your application to a CPU for the analysis.
Note
You are recommended to run the GPU-to-GPU performance modeling to analyze DPC++, OpenMP target, and OpenCL application because it provides more accurate estimations.
Optional: Generate pre-Configured Command Lines
With the Intel Advisor, you can generate pre-configured command lines for your application and hardware. Use this feature if you want to:
- Analyze an MPI application
- Customize pre-set Offload Modeling commands
Offload Modeling perspective consists of multiple analysis steps executed for the same application and project. You can configure each step from scratch or use pre-configured command lines that do not require you to provide the paths to project directory and an application executable manually.
Option 1. Generate pre-configured command lines with --collect=offload and the --dry-run option. The option generates:
- Commands for the Intel Advisor CLI collection workflow
- Commands that correspond to a specified accuracy level
- Commands not configured to analyze an MPI application. You need to manually adjust the commands for MPI.
Note: In the commands below, make sure to replace the myApplication with your application executable path and name before executing a command. If your application requires additional command line options, add them after the executable name.
The workflow includes the following steps:
- Generate the command using the
--collect=offload action with the
--dry-run option. Specify accuracy level and paths to your project directory and application executable.
For example, to generate the low-accuracy commands for the myApplication application, run the following command:
- On Linux* OS:
advisor --collect=offload --accuracy=low --dry-run --project-dir=./advi_results -- ./myApplication - On Windows* OS:
advisor --collect=offload --accuracy=low --dry-run --project-dir=.\advi_results -- .\myApplication.exe
You should see a list of commands for each analysis step to get the Offload Modeling result with the specified accuracy level (for the commands above, it is low).
- On Linux* OS:
- If you analyze an MPI application: Copy the generated commands to your preferred text editor and modify each command to use an MPI tool. For details about the syntax, see Analyze MPI Applications.
- Run the generated commands one by one from a command prompt or a terminal.
Option 2. If you have an Intel Advisor graphical user interface (GUI) available on your system and you want to analyze an MPI application from command line, you can generate the pre-configured command lines from GUI.
The GUI generates:
- Commands for the Intel Advisor CLI collection workflow
- Commands for a selected accuracy level if you want to run a pre-defined accuracy level or commands for a custom project configuration if you want to enable/disable additional analysis options
- Command configured for MPI application with Intel® MPI Library. You do not need to manually modify the commands for the MPI application syntax.
For detailed instructions, see Generate Pre-configured Command Lines.
Method 1. Use Collection Presets
For the Offload Modeling perspective, Intel Advisor has a special collection mode --collect=offload that allows you to run several analyses using only oneIntel Advisor CLI command. When you run the collection, it sequentially runs data collection and performance modeling steps. The specific analyses and options depend on the accuracy level you specify for the collection.
Note: In the commands below, make sure to replace the myApplication with your application executable path and name before executing a command. If your application requires additional command line options, add them after the executable name.
For example, to run the Offload Modeling perspective with the default (medium) accuracy level:
- On Linux* OS:
advisor --collect=offload --project-dir=./advi_results -- ./myApplication - On Windows* OS:
advisor --collect=offload --project-dir=.\advi_results -- .\myApplication.exe
The collection progress and commands for each analysis executed will be printed to a terminal or a command prompt. By default, the performance is modeled for the Intel® Arc™ graphics code-named Alchemist (xehpg_512xve configuration). When the collection is finished, you will see the result summary.
Analysis Details
To change the analyses to run and their option, you can specify a different accuracy level with the --accuracy=<level> option. The default accuracy level is medium.
The following accuracy levels are available:
- low accuracy includes Survey, Characterization with Trip Counts and FLOP collections, and Performance Modeling analyses.
- medium (default) accuracy includes Survey, Characterization with Trip Counts and FLOP collections, cache and data transfer simulation, and Performance Modeling analyses.
- high accuracy includes Survey, Characterization with Trip Counts and FLOP collections, cache, data transfer, and memory object attribution simulation, and Performance Modeling analyses. For CPU applications, also includes the Dependencies analysis.
For CPU applications, this accuracy level adds a high collection overhead because it includes the Dependencies analysis. This analysis is not required if your application is highly parallelized or vectorized on a CPU or if you know that key hotspots in your application do not have loop-carried dependencies. Otherwise, to learn how dependencies might affect your application performance on a GPU, see Check How Assumed Dependencies Affect Modeling.
For example, to run the low accuracy level:
advisor --collect=offload --accuracy=low --project-dir=./advi_results -- ./myApplicationTo run the high accuracy level:
advisor --collect=offload --accuracy=high --project-dir=./advi_results -- ./myApplicationIf you want to see the commands that are executed at each accuracy level, you can run the collection with the --dry-run option. The commands will be printed to a terminal or a command prompt.
For details about each accuracy level, see Offload Modeling Accuracy Levels in Command Line.
Customize Collection
You can also specify additional options if you want to run the Offload Modeling with custom configuration. This collection accepts most options of the Performance Modeling analysis (--collect=projection) and some options of the Survey, Trip Counts, and Dependencies analyses that can be useful for the Offload Modeling.
Important
Make sure to specify the additional options after the --accuracy option to make sure they take precedence over the accuracy level configurations.Consider the following action options:
Option |
Description |
|---|---|
--accuracy=<level> |
Set an accuracy level for a collection preset. Available accuracy levels:
For details, see Offload Modeling Accuracy Levels in Command Line. |
--config |
Select a target GPU configuration to model performance for. For example, xehpg_512xve (default), gen12_dg1, or gen9_gt3. See config for a full list of possible values and mapping to device names. |
--gpu |
Analyze a Data Parallel C++ (DPC++), OpenCL™, or OpenMP* target application on a graphics processing unit (GPU) device. This option automatically adds all related options to each analysis included in the preset. If you use this option, the high accuracy does not include the Dependencies analysis. For details about this workflow, see Run GPU-to-GPU Performance Modeling from Command Line. |
--data-reuse-analysis |
Analyze potential data reuse between code regions. This option automatically adds all related options to each analysis included in the preset. |
--enforce-fallback |
Emulate data distribution over stacks if stacks collection is disabled. This option automatically adds all related options to each analysis included in the preset. |
For details about other available options, see collect.
Method 2. Use per-Analysis Collection
You can collect data and model performance for your application by running each Offload Modeling analysis in a separate command using Intel Advisor CLI. This option allows you to:
- Control what analyses you want to run to profile your application and what data you want to collect
- Modify behavior of each analysis you run with an extensive set of options
- Remodel application performance without re-collecting performance data. This can save time if you want to see how the performance of your application might change with different modeling parameters using the same performance data as baseline
- Profile and model performance of an MPI application
Consider the following workflow example. Using this example, you can run the Survey, Trip Counts, and FLOP analyses to profile an application and the Performance Modeling to model its performance on a selected target device.
Note: In the commands below, make sure to replace the myApplication with your application executable path and name before executing a command. If your application requires additional command line options, add them after the executable name.
On Linux OS:
- Run the Survey analysis.
advisor --collect=survey --static-instruction-mix --project-dir=./advi_results -- ./myApplication - Run the Trip Counts and FLOP analyses with data transfer simulation for
the default Intel® Arc™ graphics code-named Alchemist (xehpg_512xve configuration).
advisor --collect=tripcounts --flop --stacks --cache-simulation=single --target-device=xehpg_512xve --data-transfer=light --project-dir=./advi_results -- ./myApplication - Optional: Run the Dependencies analysis to check for loop-carried dependencies.
advisor -collect=dependencies --loop-call-count-limit=16 --select markup=gpu_generic --filter-reductions --project-dir=./advi_results -- ./myApplicationThe Dependencies analysis adds a high collection overhead. You can skip it if your application is highly parallelized or vectorized on a CPU or if you know that key hotspots in your application do not have loop-carried dependencies.. If you are not sure, see Check How Assumed Dependencies Affect Modeling to learn how dependencies affect your application performance on a GPU.
- Run the Performance Modeling analysis to model application performance on
the default Intel® Arc™ graphics code-named Alchemist(xehpg_512xve configuration).
advisor --collect=projection --project-dir=./advi_resultsYou will see the result summary printed to the command prompt.
Tip: If you already have an analysis result saved as a snapshot or a result for an MPI rank, you can use the exp-dir option instead of project-dir to model performance for the result.
On Windows OS:
- Run the Survey analysis.
advisor --collect=survey --static-instruction-mix --project-dir=.\advi_results -- .\myApplication.exe - Run the Trip Counts and FLOP analyses with cache simulation for
the default Intel® Arc™ graphics code-named Alchemist (xehpg_512xve configuration).
advisor --collect=tripcounts --flop --stacks --cache-simulation=single --target-device=xehpg_512xve --data-transfer=light --project-dir=.\advi_results -- .\myApplication.exe - Optional: Run the Dependencies analysis to check for loop-carried dependencies.
advisor -collect=dependencies --loop-call-count-limit=16 --select markup=gpu_generic --filter-reductions --project-dir=.\advi_results -- myApplication.exeThe Dependencies analysis adds a high collection overhead. You can skip it if your application is highly parallelized or vectorized on a CPU or if you know that key hotspots in your application do not have loop-carried dependencies.. If you are not sure, see Check How Assumed Dependencies Affect Modeling to learn how dependencies affect your application performance on a GPU.
- Run the Performance Modeling analysis to model application performance on
the default Intel® Arc™ graphics code-named Alchemist (xehpg_512xve configuration).
advisor --collect=projection --project-dir=.\advi_resultsYou will see the result summary printed to the command prompt.
Tip: If you already have a collected analysis result saved as a snapshot or result for an MPI rank, you can use the exp-dir option instead of project-dir to model performance for the result.
For more useful options, see the Analysis Details section below.
Analysis Details
The Offload Modeling workflow includes the following analyses:
- Survey to collect initial performance data.
- Characterization with trip counts and FLOP to collect performance details.
- Dependencies (optional) to identify loop-carried dependencies that might limit offloading.
- Performance Modeling to model performance on a selected target device.
Each analysis has a set of additional options that modify its behavior and collect additional performance data. The more analyses you run and option you use, the higher the modeling accuracy.
Consider the following options:
Survey Options
To run the Survey analysis, use the following command line action: --collect=survey.
Recommended action options:
Options |
Description |
|---|---|
--static-instruction-mix |
Collect static instruction mix data. This option is recommended for the Offload Modeling perspective. |
--profile-gpu |
Analyze a DPC++, OpenCL, or OpenMP target application on a GPU device. If you use this option, skip the Dependencies analysis. For details about this workflow, see Run GPU-to-GPU Performance Modeling from Command Line. |
Characterization Options
To run the Characterization analysis, use the following command line action: --collect=tripcounts.
Recommended action options:
Options |
Description |
|---|---|
--flop |
Collect data about floating-point and integer operations, memory traffic, and mask utilization metrics for AVX-512 platforms. |
--stacks |
Enable advanced collection of call stack data. |
--cache-simulation=<mode> |
Simulate cache behavior for a target device. Available modes:
|
--target-device=<target> |
Specify a target graphics processing unit (GPU) to model cache for. For example, xehpg_512xve (default), gen12_dg1, or gen9_gt3. See target-device for a full list of possible values and mapping to device names. Use with the --cache-simulation=single option. ImportantMake sure to specify the same target device as for the --collect=projection --config=<config>. |
--data-transfer=<mode> |
Enable modeling data transfers between host and target devices. The following modes are available:
|
--profile-gpu |
Analyze a DPC++, OpenCL, or OpenMP target application on a GPU device. If you use this option, skip the Dependencies analysis. For details about this workflow, see Run GPU-to-GPU Performance Modeling from Command Line. |
Dependencies Options
The Dependencies analysis is optional because it adds a high overhead and is mostly necessary if you have scalar loops/functions in your application or if you do not know about loop-carried dependencies in key hotspots. For details about when you need to run the Dependencies analysis, see Check How Assumed Dependencies Affect Modeling.
To run the Dependencies analysis, use the following command line action: --collect=dependencies.
Recommended action options:
Options |
Description |
|---|---|
--select=<string> |
Select loops to run the analysis for. For the Offload Modeling, the recommended value is --select markup=gpu_generic, which selects only loops/functions profitable for offloading to a target device to reduce the analysis overhead. For more information about markup options, see Loop Markup to Minimize Analysis Overhead. NoteThe generic markup strategy is recommended if you want to run the Dependencies analysis for an application that does not use DPC++, C++/Fortran with OpenMP target, or OpenCL. |
--loop-call-count-limit=<num> |
Set the maximum number of call instances to analyze assuming similar runtime properties over different call instances. The recommended value is 16. |
--filter-reductions |
Mark all potential reductions with a specific diagnostic. |
Performance Modeling Options
To run the Performance Modeling analysis, use the following command line action: --collect=projection.
Recommended action options:
Options |
Description |
|---|---|
--exp-dir=<path> |
Specify a path to an unpacked result snapshot or an MPI rank result to model performance. Use this option instead of project-dir if you already have an analysis result ready. |
--config=<config> |
Select a target GPU configuration to model performance for. For example, xehpg_512xve (default), gen12_dg1, or gen9_gt3. ImportantMake sure to specify the same target device as for the --collect=tripcounts --target-device=<target>.For details about configuration files, see config. |
--no-assume-dependencies |
Assume that a loop does not have dependencies if a loop dependency type is unknown. Use this option if your application contains parallel and/or vectorized loops and you did not run the Dependencies analysis. |
--data-reuse-analysis |
Analyze potential data reuse between code regions when offloaded to a target GPU. ImportantMake sure to use --data-transfer=full with --collect=tripcounts for this option to work correctly. |
--assume-hide-taxes |
Assume that an invocation tax is paid only for the first time a kernel is launched. |
--set-parameter |
Specify a single-line configuration parameter to modify in a format "<group>.<parameter>=<new-value>". For example, "min_required_speed_up=0". For details about the option, see set-parameter. For details about some of the possible modifications, see Advanced Modeling Configuration. |
--profile-gpu |
Analyze a DPC++, OpenCL, or OpenMP target application on a GPU device. If you use this option, skip the Dependencies analysis. For details about this workflow, see Run GPU-to-GPU Performance Modeling from Command Line. |
See advisor Command Option Reference for more options.
Method 3. Use Python* Scripts
Intel Advisor has three scripts that use the Intel Advisor Python* API to run the Offload Modeling. You can run the scripts with the advisor-python command line tool or with your local Python 3.6 or 3.7.
The scripts vary in functionality and run different sets of Intel Advisor analyses. Depending on what you want to run, use one or several of the following scripts:
- run_oa.py is the simplest script with limited modification flexibility. Use this script to run the collection and modeling steps with a single command. This script is the equivalent of the Intel Advisor command line collection preset.
- collect.py is a moderately flexible script that runs only the collection step.
- analyze.py is a moderately flexible script that runs only the performance modeling step.
Note
The scripts do not support the analysis of MPI applications. For an MPI application, use the per-analysis collection with the Intel Advisor CLI.You can run the Offload Modeling using different combinations of the scripts and/or the Intel Advisor CLI. For example:
- Run run_oa.py to profile application and model its performance.
- Run the collect.py to profile application and analyze.py to model its performance. Re-run analyze.py to remodel with a different configuration.
- Run the Intel Advisor CLI to collect performance data and analyze.py to model performance. Re-run analyze.py to remodel with a different configuration.
- Run run_oa.py to collect data and model performance for the first time and run analyze.py to remodel with a different configuration.
Consider the following examples of some typical scenarios with Python scripts.
Note: In the commands below, make sure to replace the myApplication with your application executable path and name before executing a command. If your application requires additional command line options, add them after the executable name.
Example 1. Run the run_oa.py script to profile an application and model its performance for the Intel® ™ graphics code-named Alchemist (xehpg_512xve configuration).
- On Linux OS:
advisor-python $APM/run_oa.py ./advi_results --collect=basic --config=xehpg_512xve -- ./myApplication - On Windows OS:
advisor-python %APM%\run_oa.py .\advi_results --collect=basic --config=xehpg_512xve -- .\myApplication.exe
You will see the result summary printed to the command prompt.
For more useful options, see the Analysis Details section below.
Example 2. Run the collect.py to profile an application and run the analyze.py to model its performance for the Intel® Arc™ graphics code-named Alchemist (xehpg_512xve configuration).
- On Linux OS:
- Collect performance data.
advisor-python $APM/collect.py ./advi_results --collect=basic --config=xehpg_512xve -- ./myApplication - Model application performance.
advisor-python $APM/analyze.py ./advi_results --config=xehpg_512xve
You will see the result summary printed to the command prompt.
- Collect performance data.
- On Windows OS:
- Collect performance data.
advisor-python %APM%\collect.py .\advi_results --collect=basic --config=xehpg_512xve -- .\myApplication.exe - Model application performance.
advisor-python %APM%\analyze.py .\advi_results --config=xehpg_512xve
- Collect performance data.
For more useful options, see the Analysis Details section below.
Analysis Details
Each script has a set of additional options that modify its behavior and collect additional performance data. The more analyses you run and options you use, the higher the modeling accuracy.
Collection Options
The following options are applicable to the run_oa.py and collect.py scripts.
Option |
Description |
|---|---|
--collect=<mode> |
Specify data to collect for your application:
See Check How Assumed Dependencies Affect Modeling to learn when you need to collect dependency data. |
--config=<config> |
Select a target GPU configuration to model performance for. For example, xehpg_512xve (default), gen12_dg1, or gen9_gt3. ImportantFor collect.py, make sure to specify the same value of the --config option for the analyze.py.For details about configuration files, see config. |
--markup=<markup-mode> |
Select loops to collect Trip Counts and FLOP and/or Dependencies data for with a pre-defined markup algorithm. This option decreases collection overhead. By default, it is set to generic to analyze all loops profitable for offloading. |
--gpu |
Analyze a DPC++, OpenCL, or OpenMP target application on a GPU device. For details about this workflow, see Run GPU-to-GPU Performance Modeling from Command Line. |
For a full list of available options, see:
Performance Modeling Options
The following options are applicable to the run_oa.py and analyze.py scripts.
Option |
Description |
|---|---|
--config=<config> |
Select a target GPU configuration to model performance for. For example, xehpg_512xve (default), gen12_dg1, or gen9_gt3. ImportantFor analyze.py, make sure to specify the same value of the --config option for the collect.py.For details about configuration files, see config. |
--assume-parallel |
Assume that a loop does not have dependencies if there is no information about the loop dependency type and you did not run the Dependencies analysis. |
--data-reuse-analysis |
Analyze potential data reuse between code regions when offloaded to a target GPU. ImportantMake sure to use --collect=full when running the analyses with collect.py or use the --data-transfer=full when running the Trip Counts analysis with Intel Advisor CLI. |
--gpu |
Analyze a DPC++, OpenCL, or OpenMP target application on a GPU device. For details about this workflow, see Run GPU-to-GPU Performance Modeling from Command Line. |
For a full list of available options, see:
Next Steps
Continue to explore the Offload Modeling results with a preferred method. For details about the metrics reported, see Accelerator Metrics.