After identifying hotspots, use the GPU Roofline Insights perspective to analyze their performance deeper. Select a dot on the chart and use GPU Details and Recommendations tabs in the right-side pane to examine code analytics for a specific kernel in more details and view actionable recommendations for code optimization.
Note
Families of Intel® Xe graphics products starting with Intel® Arc™ Alchemist (formerly DG2) and newer generations feature GPU architecture terminology that shifts from legacy terms. For more information on the terminology changes and to understand their mapping with legacy content, see GPU Architecture Terminology for Intel® Xe Graphics.Get Recommendations
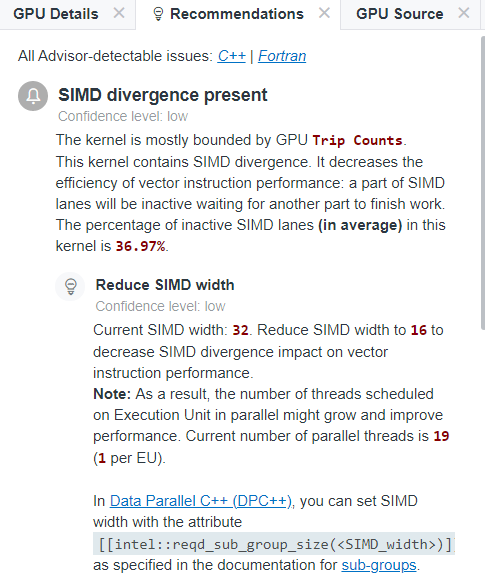
Check the Performance Issues column of the GPU pane to see if Intel® Advisor identifies any recommendations for a kernel.
Select a kernel on a Roofline chart and switch to Recommendations tab to view actionable recommendations helping you optimize your code for compute and memory bound applications running on GPU. Expand a recommendation to access a full description and a code sample containing a possible solution of the problem.
Review Compute and Memory Bandwidth Utilization
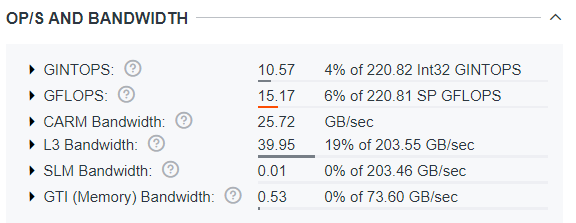
Review how well your kernel uses the compute and memory bandwidth of your hardware in the OP/S and Bandwidth pane. It indicates the following metrics:
- The total number of floating-point and integer operations transferred by the kernel per second as a percentage of the maximum compute capacity of your hardware. The red bar represents the dominant operation data type used in the kernel.
- The amount of data transferred by the kernel at each cache memory level per second as a percentage of the memory level bandwidth. Cache memory level bandwidth utilization (in per cent) is a ratio of effective bandwidth and maximum bandwidth of a given memory level. This metric shows how well the kernel uses the capability of your hardware and can help you identify bottlenecks for your kernel.
For example, in the screenshot below, the dominating data type is FLOP. The kernel utilizes 19% of L3 Bandwidth. Considering these data and compared to utilization metrics for other memory levels and compute capacity, the Roofline chart displays the L3 Bandwidth as the main factor limiting the performance of the kernel.
Review how your application uses memory levels using the Memory Metrics pane:
- Review how much time the kernel spends processing requests for each memory level in relation to the total time, in perspective, reported in the Impacts histogram.
A big value indicates a memory level that bounds the selected kernel. Examine the difference between the two largest bars to see how much throughput you can gain if you reduce the impact on your main bottleneck. It also gives you a long-time plan to reduce your memory bound limitations as once you will solve the problems coming from the widest bar, your next issue will come from the second biggest bar and so on.
Ideally, you should see the L3 or SLM as the most impactful memory.
- Review an amount of data that passes through each memory level reported in the Shares histogram.
Note
Data in the Memory Metrics pane is based on a dominant type of operations in your code (FLOAT or INT).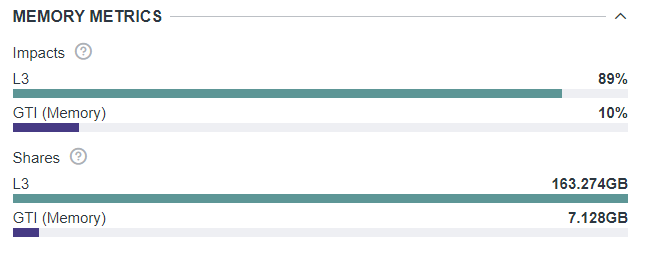
Explore Operation Types Used During Application Execution
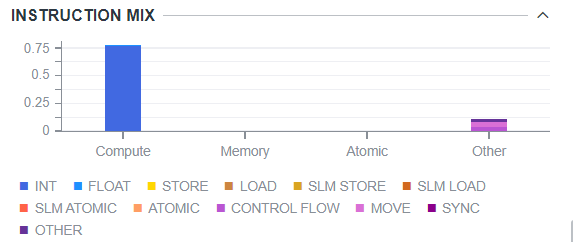
Examine instruction types that the kernel executes in the Instruction Mix pane. For example, in a screenshot below, the kernel mostly executes compute instructions with integer operations, which means that the kernel is mostly compute bound.
Intel Advisor automatically determines the data type used in operations and groups the instructions collected during Characterization analysis by the following categories:
Category |
Instruction Types |
|---|---|
Compute (FLOP and INTOP) |
|
Memory |
LOAD, STORE, SLM_LOAD, SLM_STORE types depending on the argument: send, sendc, sends, sendsc |
Other |
|
Atomic |
SEND |
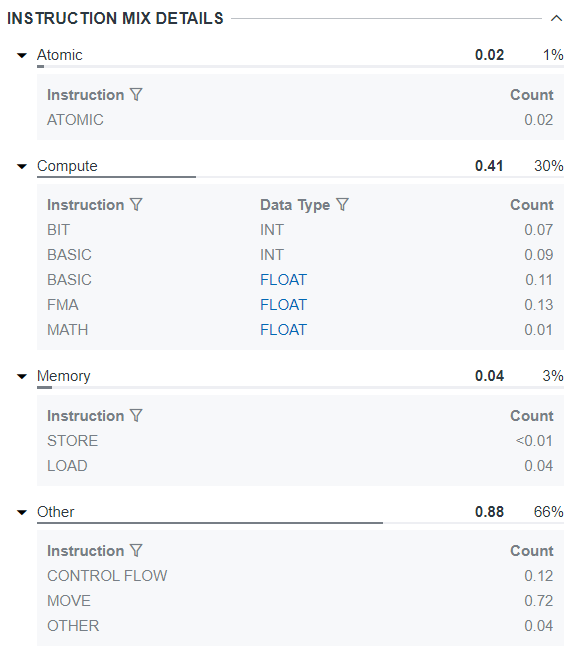
Get more insights about instructions used in your kernel using Instruction Mix Details pane:
- Examine instruction count for each category as well as its percentage in overall instruction mix to determine the dominating category of instructions in the kernel.
- Examine instruction count for each type of compute, memory, atomics, and other instructions.
- For compute instructions, view the dominating data type for each type of instructions.
Note
The data type dominating in the entire kernel is highlighted blue.
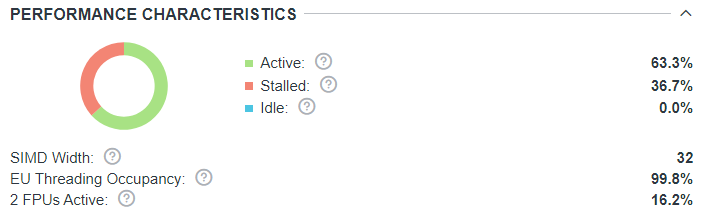
In the Performance Characteristics, review how effectively the kernel uses the GPU resources: activity of all execution units, percentage of time when both FPUs are used, percentage of cycles with a thread scheduled. Ideally, you should see a higher percentage of active execution units and other effectiveness metrics to use more GPU resources.