Explore the overview of program metrics and operations and memory data for your application using the Summary report of GPU Roofline Insights.
Note
Families of Intel® Xe graphics products starting with Intel® Arc™ Alchemist (formerly DG2) and newer generations feature GPU architecture terminology that shifts from legacy terms. For more information on the terminology changes and to understand their mapping with legacy content, see GPU Architecture Terminology for Intel® Xe Graphics.Explore Program Metrics for Code Regions Executed on GPU
Get the insight into performance of your entire application and evaluate the following using the Program Metrics pane:
- How much time your application spends on CPU and on GPU in relation to the total time of the application to understand if your application is CPU-bound or GPU-bound
- How much time your application spends on transferring data between CPU and GPU
- How well your application utilizes the floating-point units (FPUs) for parallel execution of operations
- How many threads in each execution unit your application occupies to execute compute operations
- How your application utilizes FPU pipelines and how many instructions it executes per cycle
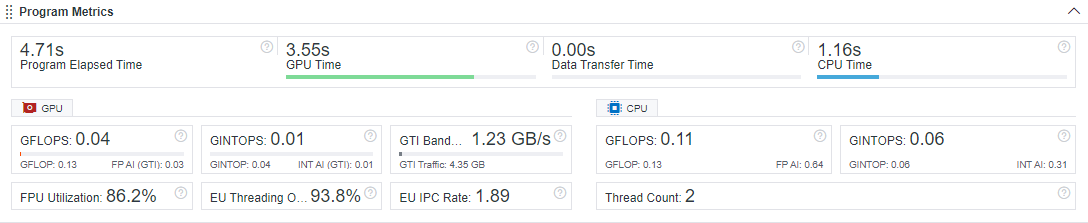
Note
For discrete GPUs, FPU Utilization and EU IPC Rate metrics are unavailable.Identify Dominating Data Types and Hotspots
Intel Advisor profiles your application during its execution and identifies the dominating data type in operations and top hotspots for optimization.
- Explore the operations and identify the dominating data type in the
OP/S and Bandwidth pane. Use this data to see if the compiler generates integer operations (INTOP) or floating-point operations (FLOP) that are not obvious.
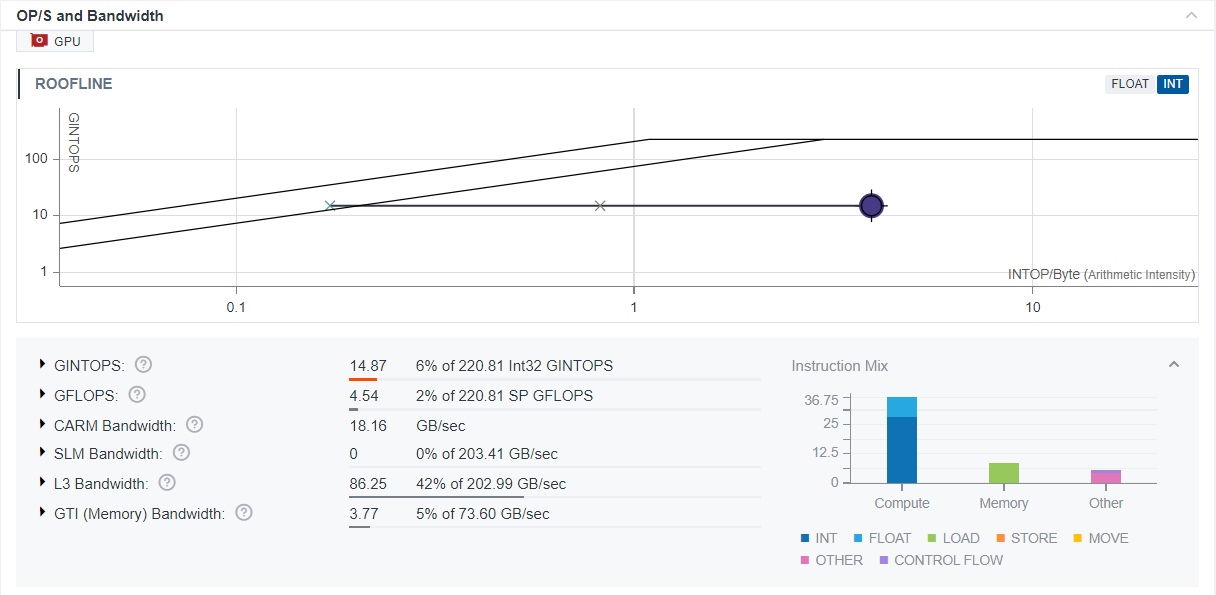
- View the list of top hotspots on the GPU in the
Top Hotspots pane and examine their performance in relation to compute performance and memory bandwidth using the Roofline chart in the
OP/S and Bandwidth pane. These hotspots are the best candidates for optimization as they have the greatest impact on the application total time. To view detailed information about the performance of each kernel and visualize it against hardware limitations, double-click a hotspot in the pane or a dot on a roofline chart.
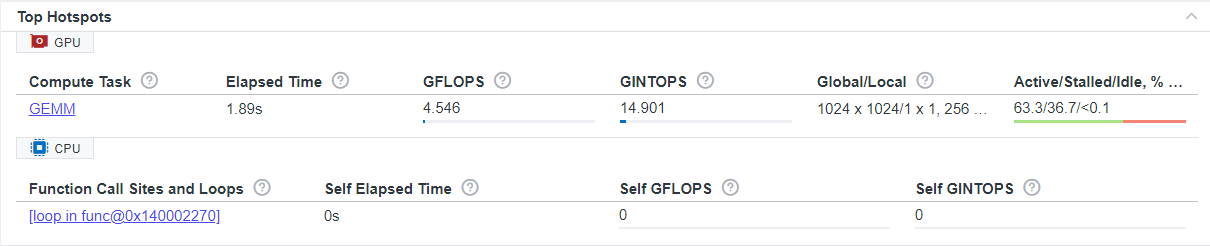
Other analyses and properties are for a CPU Roofline part of the result, which shows metrics for loops/functions executed on CPU. For details about CPU Roofline data, see CPU / Memory Roofline Insights.
Next Steps
Examine Bottlenecks on GPU Roofline Chart.