Accuracy Level
Low
Enabled Analyses
Survey + FLOP (Characterization)
Result Interpretation
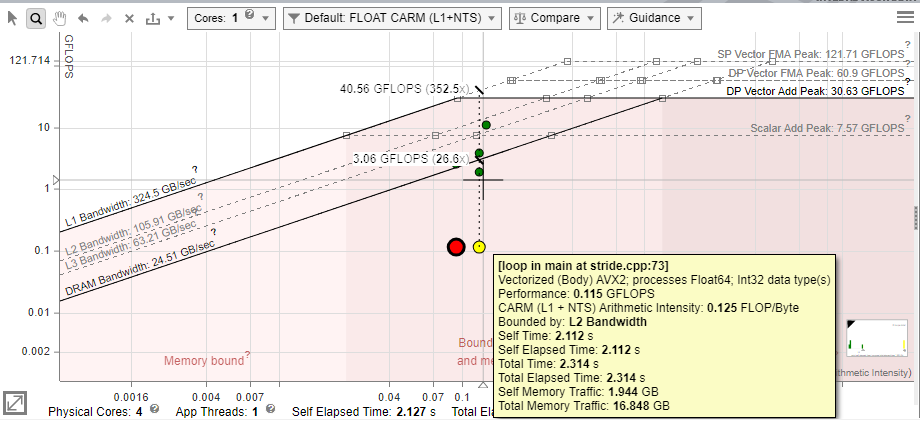
The farther a dot is from the topmost roofs, the more room for improvement there is. In accordance with Amdahl's Law, optimizing the loops that take the largest portion of the program's total run time will lead to greater speedups than optimizing the loops that take a smaller portion of the run time.
Note
This topic describes data as it is shown in the CPU Roofline report in the Intel Advisor GUI. You can also view the result in an HTML report, but data arrangement and panes may vary.- By dot size and color, identify loops that take most of total program time and/or located very low in the chart. For example:
- Small, green dots take up relatively little time, so are likely not worth optimizing.
- Large, red dots take up the most time, so the best candidates for optimization are the large, red dots with a large amount of space between them and the topmost roofs.
Note
You can switch between coloring the dots by execution time and coloring the dots by type (scalar or vectorized) in the roof view menu on the right. - Depending on the dots position, identify what the loops are bounded by.
Intel® Advisor marks the roofline zones on the chart to help you identify what roofs bound the loop:
- Loop is bounded by memory roofs.
- Loop is bounded by compute roofs.
- Loop is bounded by both memory and compute roofs.
- In the Recommendations tab, scroll down to the Roofline Guidance section that provides you hints on next optimization steps for a selected loop/function.
The roofs above a dot represent the restrictions preventing it from achieving a higher performance, although the roofs below can contribute somewhat. Each roof represents the maximum performance achievable without taking advantage of a particular optimization, which is associated with the next roof up. Depending on a dot position, you can try the following optimizations.
Note
For more precise optimization recommendations, see the Roofline Guidance in Code Analytics and Roofline Conclusions in Recommendations tabs.Dot Position |
Reason |
To Optimize |
|---|---|---|
Below a memory roof (DRAM Bandwidth, L1 Bandwidth, so on) |
The loop/function uses memory inefficiently. |
Run a Memory Access Patterns analysis for this loop.
|
Below Vector Add Peak |
The loop/function under-utilizes available instruction sets. |
Check Traits column in the Survey report to see if FMAs are used.
|
Just above Scalar Add Peak |
The loop/function is undervectorized. |
Check vectorization efficiency and performance issues in the Survey. Follow the recommendations to improve it if it's low. |
Below Scalar Add Peak |
The loop/function is scalar. |
Check the Survey report to see if the loop vectorized. If not, try to get it to vectorize if possible. This may involve running Dependencies to see if it's safe to force it. |
In the following
Roofline chart representation, loops A and G (large red dots), and to a lesser extent B (yellow dot far below the roofs), are the best candidates for optimization. Loops C, D, and E (small green dots) and H (yellow dot) are poor candidates because they do not have much room to improve or are too small to have significant impact on performance.
Some algorithms are incapable of breaking certain roofs. For instance, if Loop A in the example above cannot be vectorized due to dependencies, it cannot break the Scalar Add Peak.
Tip
If you cannot break a memory roof, try to rework your algorithm for higher arithmetic intensity. This will move you to the right and give you more room to increase performance before hitting the memory bandwidth roof. This would be the appropriate approach to optimizing loop F in the example, as well as loop G if its cache usage cannot be improved.Analyze Specific Loops
Select a dot on the chart, open the Code Analytics tab to view detailed information about the selected loop:
- Refer to
Loop Information pane to examine total time, self time, instruction sets used, and instruction mix for the selected loop. Intel Advisor provides:
- Static instruction mix data that is based on static assembly code analysis within a call stack. Use static instruction mix to examine instruction sets in the inner-most functions/loops.
- Dynamic instruction mix that is based on dynamic assembly code analysis. This metric represents the total count of instructions executed by your function/loop. Use dynamic instruction mix to examine instruction sets in the outer loops and in complex loop-nests.
Intel Advisor automatically determines the data type used in operations. View the classes of instructions grouped by categories in instruction mix:
Category
Instruction Types
Compute (FLOP and INTOP) ADD, MUL, SUB, DIV, SAD, MIN, AVG, MAX, ABS, SIN, SQRT, FMA, RCCP, SCALE, FCOM, V4FMA, V4VNNI Memory - scalar and vector MOV instructions
- GATHER/SCATTER instructions
- VBMI2 compress/expand instructions
Mixed Compute instructions with memory operands Other MOVE, CONTROL FLOW, SYNC, OTHER Note
Intel Advisor counts FMA and VNNI instructions as more than 1 operation depending on the size of the data type and/or the type of vector registers used. - Refer to
Roofline pane for more details about a specific roof that bounds the loop:
- View roofs with number of threads, data types, and instructions mix used in the loop
- Identify what exactly bounds the selected loop - memory, compute, or both memory and compute
- Determine the exact roof that bounds the loop and estimates a potential speedup for the loop in the callout if you optimize it for this roof
- Refer to
Statistics for operations pane to view the count of operations collected during Characterization analysis. Depending on the operations you need, use a drop-down list to choose FLOP, INTOP, FLOP+INTOP or All Operations. Switch between Self and Total data using the toggle in the top right-hand corner of the pane.
Intel Advisor calculates floating-point operations (FLOP) as a sum of the following classes of instructions multiplied by their iteration count: FMA, ADD, SUB, DIV, DP, MUL, ATAN, FPREM, TAN, SIN, COS, SQRT, SUB, RCP, RSQRT, EXP, VSCALE, MAX, MIN, ABS, IMUL, IDIV, FIDIVR, CMP, VREDUCE, VRND
Integer operations (INTOP) are calculated in two modes:
- Potential INT operations (default) that include loop counter operations that are not strictly calculations (for example, INC/DEC, shift, rotate operations). In this case, INTOP is a sum of the following instructions multiplied by their iteration count: ADD, ADC, SUB, MUL, IMUL, DIV, IDIV, INC/DEC, shifts, rotates
- Strict INT operations (available in Python* API only) that include only calculation operations. In this case, INTOP is a sum of the following instructions multiplied by their iteration count: ADD, MUL, IDIV, SUB