Accuracy Level
High
Enabled Analyses
Survey with register spill/fill analysis + Trip Counts, FLOP, Call Stacks (Characterization) + Memory Access Patterns
Note
Collecting additional data may substantially increase report generation time. There is a variety of techniques available to minimize data collection, result size, and execution time. Check Minimize Analysis Overhead.Result Interpretation
After you run the Vectorization and Code Insights perspective with high accuracy and full Characterization and Memory Access Patterns steps enabled, Intel® Advisor:
- Extends the Survey report with the Compute Performance and Memory metrics.
- Adds Memory Access Patterns data to the Refinement Report tab.
In the Survey report
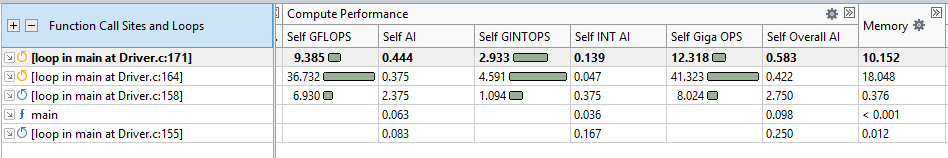
Use the FLOP data to analyze application memory usage and performance values that help you make better decisions about your vectorization strategy.
Compute Performance column
You can configure this column to show only metrics for a specific type of operations used in your application. Click the
 control in the
Compute Performance column set header and choose the desired drop-down option to:
control in the
Compute Performance column set header and choose the desired drop-down option to:
- Show data for floating-point operations only, for integer operations only, or for both floating-point and integer operations.
- Determine what is counted as an integer operation in integer calculations:
- Choose Show Pure Compute Integer Operations to count only ADD, MUL, IDIV, and SUB operations.
- Choose Show All Operations Processing Integer Data to count ADD, ADC, SUB, MUL, IMUL, DIV, IDIV, INC/DEC, shift, and rotate operations.
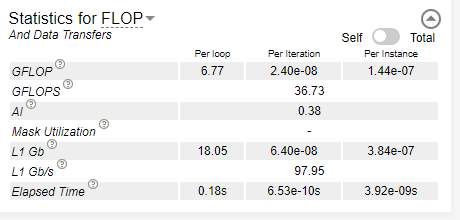
Select a specific loop/function to see the details about FLOP and/or integer operation utilization in the Code Analytics tab:
Memory column
You can configure this column to show only metrics for one or more specific memory levels and specific types of operations. Click the gear icon in the Memory column set header and choose the desired drop-down option to determine which columns to display in the grid:
Note
This data is only available if cache simulation is enabled. By default, Intel® Advisor collects only L1 traffic, so you will not be able to select memory levels or loads/stores.- Show data for L1, L2, L3, or DRAM memory metrics, or show a Customized Column Layout.
- Show data for memory load operations only, store operations only, or the sum of both.
You can choose to hide the current column, Show All Columns, or customize the columns displayed in the grid by choosing Configure Column Layouts.
You can use the traffic and AI data reported in the Compute Performance and Memory columns to find the best candidates to examine the memory usage for in the Memory Access Patterns tab. For example, bad access pattern has stronger impact on loops/functions with higher AI value suggesting that you start with optimizing their memory usage.
In the Refinement report
Important
Before running the Memory Access Patterns analysis, select loops/functions from the column in the Survey report.
Get information about types of memory access in selected loops/functions, how you traverse your data, and how it affects your vector efficiency and cache bandwidth usage by running the Memory Access Patterns analysis.
Memory access patterns affect how data is loaded into and stored from the vector registers.
To analyze how the data structure layout affects performance, pay attention to the following:
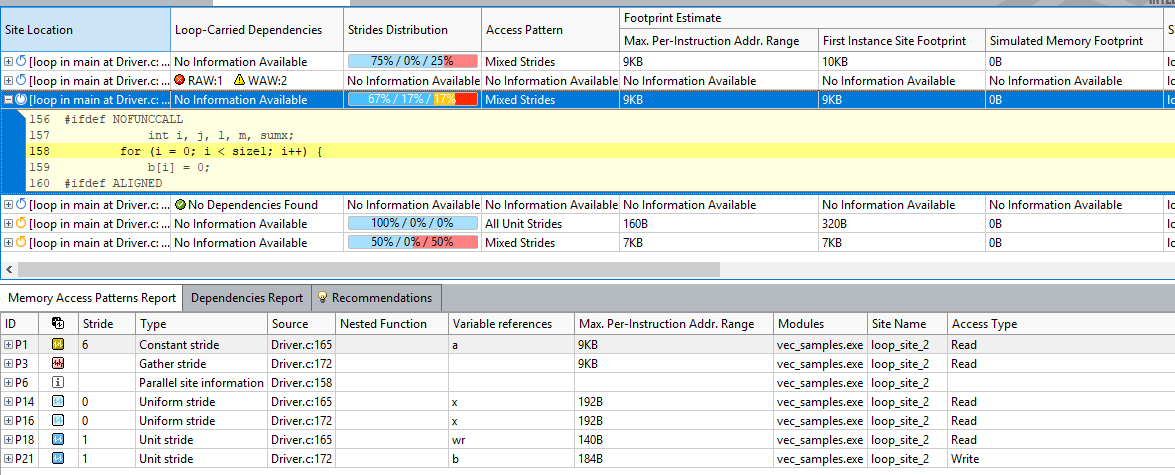
- Look for loops/functions that do not have "All Unit Strides" in the Access Pattern column to find optimization candidates.
- Strides Distribution column reports the ratio of stride types for a selected loop/function and is color-coded:
- Blue is unite/uniform stride, which means that the instruction access memory sequentially or within the distance of one element.
- Yellow is constant stride, which means that the instructions access memory with the constant step of more than one element.
- Red is irregular stride, which means that the instructions access memory addresses that change by an unpredictable number of elements from iteration to iteration.
For vectorization, unit stride is the preferred distribution. Your goal is to eliminate irregular strides and minimize the constant stride to optimize memory usage.
- Click a loop in the top pane to see a detailed report for this loop below in the
Memory Access Patterns Report tab.
- Review details for each stride type that contributes to the loop/function with corresponding source locations.
- Review the size of the strides, variables accessed, and source locations and modules.
- To optimize memory access patterns, follow the Intel® AdvisorRecommendations for specific loops/functions.
In the Memory Analysis Patterns Report tab at the bottom of the Refinement Reportsdouble-click a line to view the selected operation's source code.
Associated Memory Access Patterns Source window, from top left to bottom right:
View Activation pane - Enable or disable views shown in the Source view.
Source View pane - View source code of the selected loop/function.
Assembly View pane - View assembly source of the selected loop/function.
Details View pane - View details of the selected site.
Next Steps
- Run CPU / Memory Roofline Insights perspective to get a detailed view about your application performance.
- Cookbook: Optimize Memory Access Patterns Using Loop Intercharge and Cache Blocking Technique