The View contains the options that apply to the entire View.
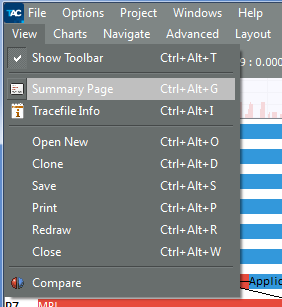
These options are:
| Option: | Keyboard Shortcut: | Description: |
|---|---|---|
| Show Toolbar | Ctrl+Alt+T |
Have easy access to the Intel® Trace Analyzer functionality that is most often used |
| Summary Page | Ctrl+Alt+G |
Get summary information about the time your application spent in MPI |
| Tracefile Info | Ctrl+Alt+I |
Get information about the current trace |
| Open New | Ctrl+Alt+O |
Open a new View with the Charts previously selected in the Tracefile preferences tab of the Preferences dialog box. |
| Clone | Ctrl+Alt+D |
Create a one-to-one clone of the current View |
| Save | Ctrl+Alt+S |
Save the entire View as a picture |
Ctrl+Alt+P |
Print a copy of the View | |
| Redraw | Ctrl+Alt+R |
Repaint the entire View |
| Close | Ctrl+Alt+W |
Close the current View. If the last View for a trace file is closed, the trace file is closed as well. |
| Compare | None | Choose the trace files for comparison and compare them with the help of the Comparison dialog box. The traces may represent two runs or two ranges of the same run. Comparison dialog box displays data from the two trace files. |
| Configure Trace Collector | None | Open the Configuration Assistant |