To access this Intel Inspector window: Click the Summary button on the Navigation toolbar.
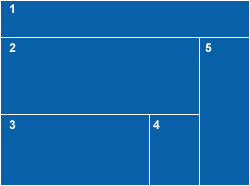
The Summary window shows application problems detected during analysis, problem severity, and associated code locations. It also provides access to generic error explanations and corresponding source code in your default editor. Use this window to view problems displayed in the order detected and choose problems of interest to display in the Sources window.
Window Layout
|
Window Panes and Toolbars |
