Follow this recipe to understand how you can use Flame Graphs to detect hotspots and hot code paths in Java workloads.
Content experts: Dmitry Kolosov, Roman Khatko, and Elena Nuzhnova
A flame graph is a visual representation of the stacks and stack frames in your application. The graph plots all of the functions in your application on the X-axis and displays the stack depth on the Y-axis. Functions are stacked in order of ancestry, with parent functions directly below child functions. The width of a function displayed in the graph is an indication of the amount of time it engaged the CPU. Therefore, the hottest functions in your application occupy the widest portions on the flame graph.
You can use flame graphs when you run the hotspots analysis with stacks on any of these workloads:
- C++
- FORTRAN
- Java
- .NET
- Python
This recipe uses a Java application as an example. Typically, a poor selection of parameters (either sub-optimal or incorrect) for the Java Virtual Machine (JVM) can result in slow application performance. The slowdown is not always obvious to analyze or explain. When you visualize the application stacks in a flame graph, you may find it easier to identify hot paths for the application and its mixed stacks (Java and built-in).
Note
If you are interested in С++ optimization, you may want to see the Improving Hotspot Observability in a C++ Application Using Flame Graphs recipe. It demonstrates how the Flame Graph can help in a scenario where the bottleneck is obscured by an unclear hot path and long template function names.Ingredients
Here are the hardware and software tools we use in this recipe:
- Application:
SPECjbb2015® Benchmark. This benchmark is relevant to anyone who is interested in Java server performance including:
- JVM vendors
- Hardware developers
- Java application developers
- Researchers and members of the academic community
- OpenJDK11. This application is the open source reference implementation of the Java SE Platform (version 11) as specified by JSR384 in the Java Community Process.
Performance Analysis Tools: Hotspots Analysis in Intel® VTune™ Profiler (version 2021.7 or newer)
Note
Starting with the 2020 release, Intel® VTune™ Amplifier has been renamed to Intel® VTune™ Profiler.
Most recipes in the Intel® VTune™ Profiler Performance Analysis Cookbook are flexible. You can apply them to different versions of Intel® VTune™ Profiler. In some cases, minor adjustments may be required.
Get the latest version of Intel® VTune™ Profiler:
From the Intel® VTune™ Profiler product page.
Download the latest standalone package from the Intel® oneAPI standalone components page.
- Operating System: Ubuntu* 18.04.1 LTS
- CPU: Intel® Xeon® Gold 6252 processor architecture codenamed Cascade Lake
Create a Baseline
- For the purpose of this recipe, let us first shorten the runtime of SPECjbb2015. Change these properties in the
config/specjbb2015.props file:
specjbb.input.number_customers=1
specjbb.input.number_products=1
- In accordance with popular optimization practices and guidance, start optimizing the application with -XX:+UseParallelOldGC and -XX:-UseAdaptiveSizePolicy JVM options.
- Make sure to tune these parameters for optimal performance of your Java application:
- Garbage Collection (GC) Algorithm - When you enable the UseParallelOldGC option, you can collect old and young generation collections in parallel. Garbage collection can then work more efficiently because you have reduced the overall full GC pause. If throughput is your goal, specify -XX:+UseParallelOldGC.
- Heap Tuning - By default, JVMs adapt their heap based on runtime heuristics. To achieve pause, throughput, and footprint goals, the GC can resize heap generations based on GC statistics. In some cases, to increase throughput, you may want to disable this option and set the heap size manually. Use the heap as a performance baseline for further optimizations.
java -XX:-UseAdaptiveSizePolicy -XX:+UseParallelOldGC -jar specjbb2015.jar –m COMPOSITE
Run Hotspots Analysis
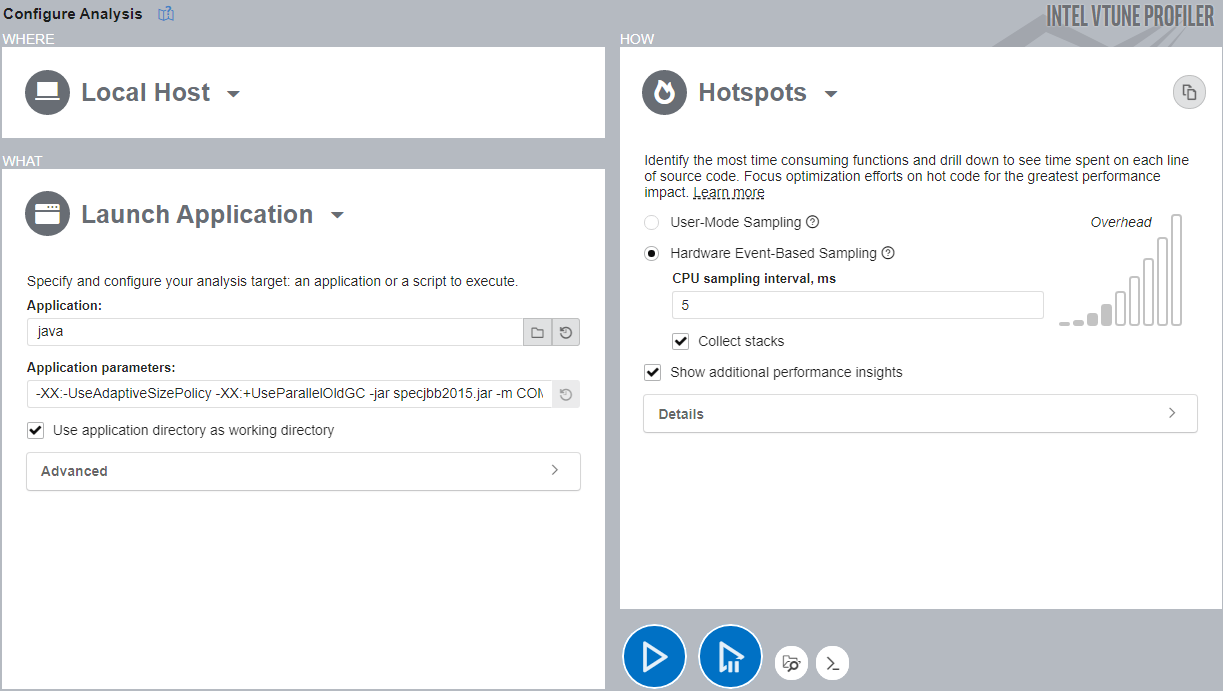
- Run VTune Profiler (version 2021.7 or newer).
- In the Welcome screen, click Configure Analysis.
- In the WHERE pane, select Local Host.
- In the
WHAT pane, enter these values:
- Application:java
- Application parameters: -XX:-UseAdaptiveSizePolicy -XX:+UseParallelOldGC -jar specjbb2015.jar -m COMPOSITE
- In the HOW pane, open the Analysis Tree and select Hotspots analysis in the Algorithm group.
- Select Hardware Event-Based Sampling mode and check the Collect stacks option.
- Click the Start button to run the analysis.
VTune Profiler profiles the Java application and collects data. Once this process completes, VTune Profiler finalizes the collected results and resolves symbol information.
Analyze Hotspots Information
Start your analysis in the Summary window, where you can see high level statistics on the execution of your application. Focus on the Elapsed Time and Top Hotspots sections.
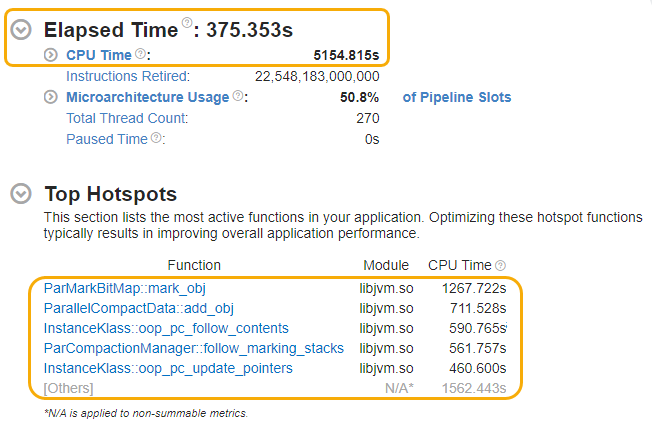
In this example, we see that the elapsed time for SPECjbb2015 was around 375 seconds.
The top five hotspots in the summary are in JVM functions. No Java/Application functions appear in this list.
Look at the Bottom-up window next to continue searching for hotspots.
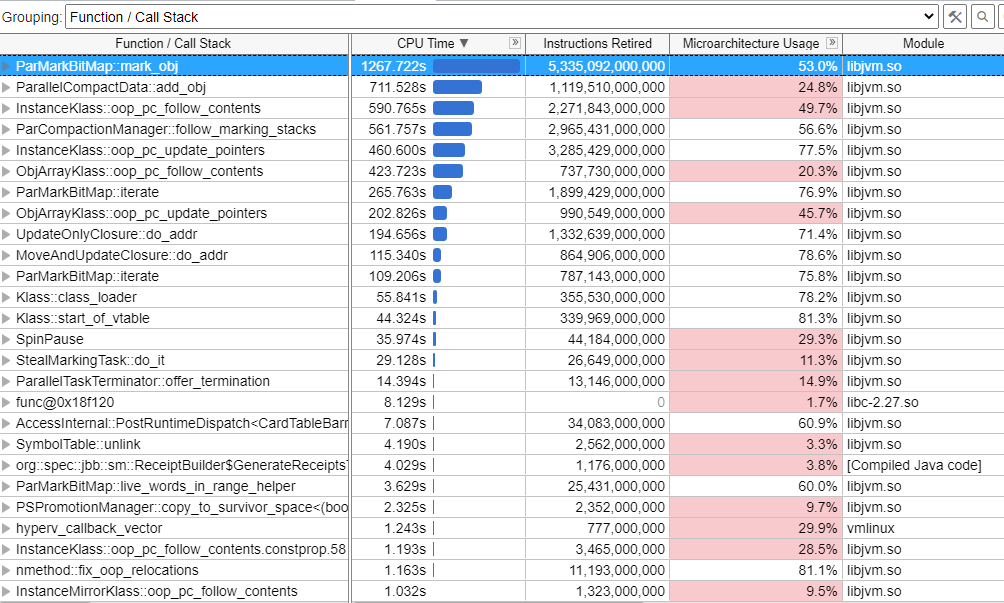
Although the Bottom-up window displays more hotspots in the JVM, we need a deeper analysis to explain the slowdown of the Java application. This would require an expansion of bunches of parent functions for every hotspot in the table above.
Let us now look at the flame graph for this data, where we can observe all application stacks at once and possibly identify hot code paths.
Identify Hot Code Paths in the Flame Graph
Switch to the Flame Graph window.
A Flame Graph is a visual representation of the stacks and stack frames in your application. Every box in the graph represents a stack frame with the complete function name. The horizontal axis shows the stack profile population, sorted alphabetically. The vertical axis shows the stack depth, starting from zero at the bottom. The flame graph does not display data over time. The width of each box in the graph indicates the percentage of the function CPU time to total CPU time. The total function time includes processing times of the function and all of its children (callees).
The Flame Graph window contains a Call Stacks view, which displays the hottest stack when selected in the flame graph. You can also observe other stacks by selecting a function or drill down to its source code.
The flame graph uses a color scheme to display these types of functions:
| Function Type | Description |
|---|---|
User |
A function from the application module of the user. |
System |
A function from the System or Kernel module |
Synchronization |
A synchronization function from the Threading Library (like OpenMP Barrier) |
Overhead |
An overhead function from the Threading library (like OpenMP Fork or OpenMP Dispatcher) |
Follow these techniques as you examine the information displayed in the flame graph.
- Start optimizing from the bottommost function and work your way up. Focus on hot functions that are wide on the flame graph.
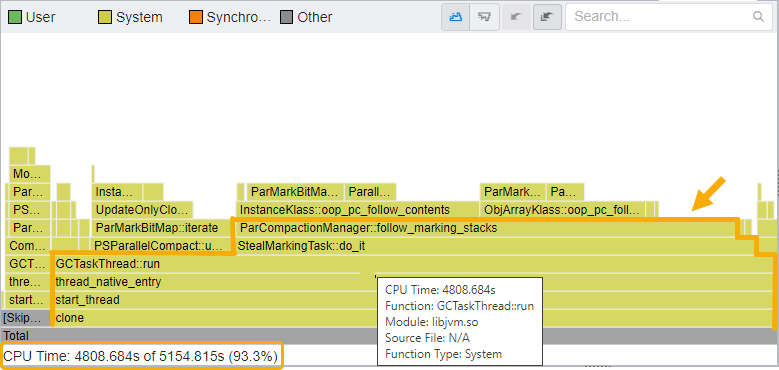
- In this example, the flame graph displays stacks and frames that are only from the JVM. Therefore almost all of the CPU time was spent in the JVM.
- Consequently, the CPU time spent on the application was significantly low. Application stacks or frames are not even visible in the flame graph.
- The hottest code path is clone --> start_thread --> thread_native_entry --> GCTaskThread::run --> StealMarkingTask::do_it --> and so on.
- Pay attention to the GCTaskThread::run function/frame, which runs Java Garbage Collector tasks.
- When you hover over GCTaskThread::run function/frame, you can see in the details at the bottom that 93.3% of CPU Time was spent on the function and its callees.
Therefore, a lot of CPU Time was spent in the Java Garbage Collector.
Change JVM Options
The -XX:-UseAdaptiveSizePolicy JVM option may not allow the application to adapt to the size of the JVM heap. The default values used for the run may also be insufficient. Let us now change the size of the JVM heap to decrease the executing time of the Garbage Collector (GC).
The -Xms and -Xmx options are used to set the operating range of the JVM where it can resize the heap. If the two values are the same, the heap size remains constant. It is good practice to refer to the JVM logs before you set values for these options.
Let us change the -Xms and -Xmx JVM options for the application to 2GB and 4GB respectively. We will then collect a new profile:
- Click the Configure Analysis button in the Welcome screen of VTune Profiler.
- In the WHERE pane, select Local Host.
- In the WHAT pane, set Application to java.
- Change application parameters. Use -Xms2g -Xmx4g -XX:-UseAdaptiveSizePolicy -XX:+UseParallelOldGC -jar specjbb2015.jar -m COMPOSITE.
- Click Start to run the analysis.
Once the data collection completes, check the Elapsed Time and Top Hotspots in the Summary window.
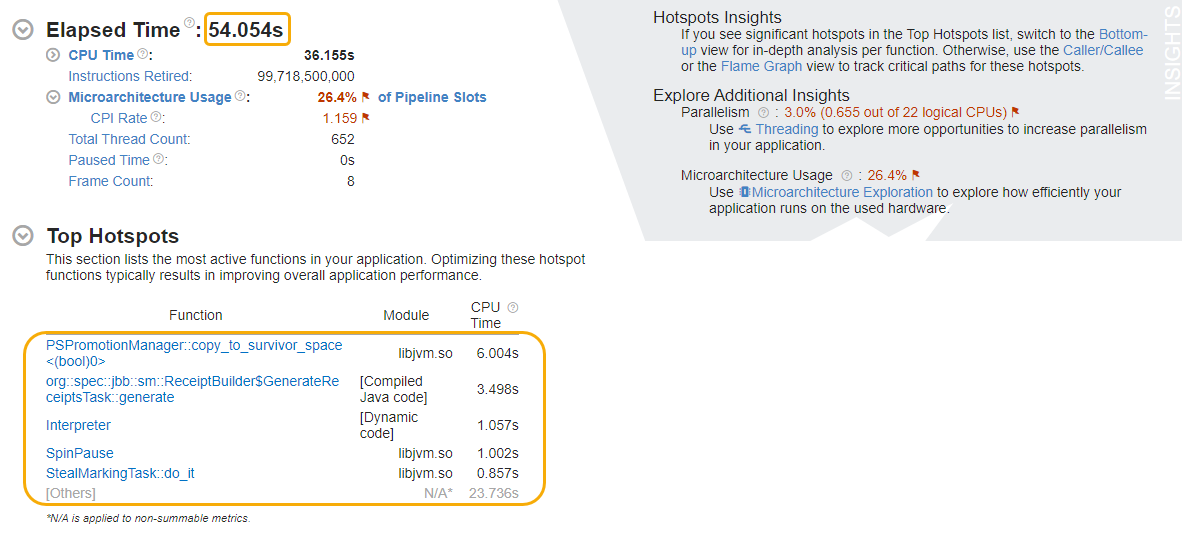
- We can observe a 6x reduction in Elapsed Time from ~375 s to ~54s.
- The Top Hotspots section also displays a new list of functions (including the GenerateReceipts task) with shorter CPU times.
Switch to the Flame Graph window to identify new hot code paths.
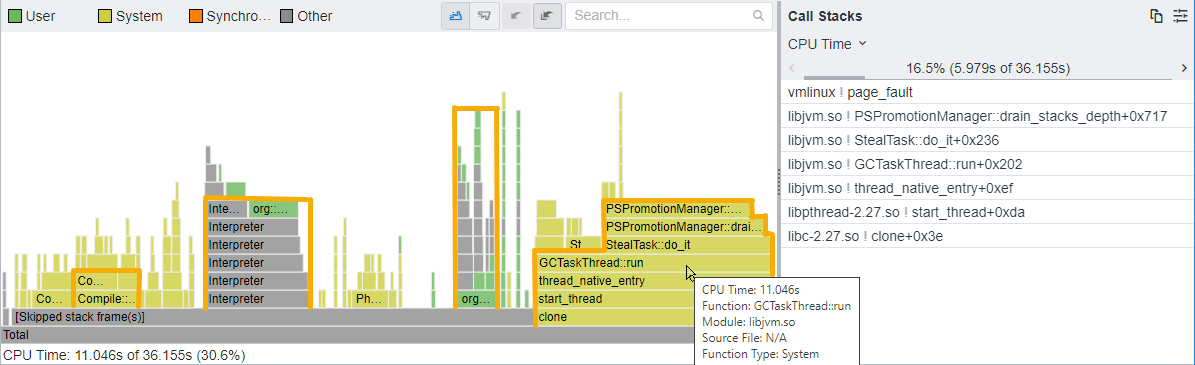
The flame graph shows a hot code path that includes the JVM GCTaskThread.
However, this hot code path uses only 30.6% of CPU Time compared to 93.3% on the previous run.
- You may want to focus on new hot code paths that proceed in this direction:
- JVM Compile::Compile —> ...
- JVM Interpreter —> org::spec::jbb::sm::ReceiptBuilder
- org::spec::jbb::sm::ReceiptBuilder —> ...
- Review your JVM options to identify more opportunities for optimization.
- If you want to optimize the JVM next, a good starting point is to focus on the
Microarchitecture Usage metric and follow recommendations in the
Insights section of the
Summary window:
- Apply Threading to increase parallelism n your application.
- Run the Microarchitecture Exploration analysis to examine the efficiency of application runs on the hardware used.