This recipe helps you set up a Virtual Machine instance in the Hyper-V environment for hardware performance profiling with Intel® VTune™ Profiler.
Content expert: Alexey Kireev, Denis Pravdin
Ingredients
This section lists the hardware and software tools used for the performance analysis scenario.
Tools:
Intel® VTune™ Profiler (or any release of the Intel® VTune™ Amplifier 2019)
Note
Starting with the 2020 release, Intel® VTune™ Amplifier has been renamed to Intel® VTune™ Profiler.
Most recipes in the Intel® VTune™ Profiler Performance Analysis Cookbook are flexible. You can apply them to different versions of Intel® VTune™ Profiler. In some cases, minor adjustments may be required.
Get the latest version of Intel® VTune™ Profiler:
From the Intel® VTune™ Profiler product page.
Download the latest standalone package from the Intel® oneAPI standalone components page.
A third-party virtual machine manager (VMM) may also be required.
CPU: Intel® Xeon® processor that supports Intel® Virtualization Technology (Intel® VT)
You can also use any Intel microarchitecture with performance monitoring hardware, such as:
Intel Microarchitecture code name
PMU Version
PEBS
LBR
IPT
PT2GPA
4
Yes
Yes
Yes
No
4
Yes
Yes
Yes
Yes
4
Yes
Yes
Yes
No
4
Yes
Yes
Yes
No
4
Yes
Yes
No
No
3
Yes
Yes
No
No
3
Yes
Yes
No
No
Operating system: Microsoft* Windows Server 2019 or Windows 10 Version 1809 (October 2018 Update) or later
BIOS with Intel VT support
Note
Hyper-V may impose additional requirements described in the Enable Intel Performance Monitoring Hardware in a Hyper-V virtual machinearticle.
Configure a Hyper-V Host
Enable the Intel VT in the BIOS setup on your server:
- Access the system BIOS by pressing F2 during the system power-on self test (POST).
- Click Advanced > Processor Configuration.
Select Intel® Virtualization Technology and change to Enabled.
Do an AC power cycle for changes to take effect.
Go to Control Panel > Programs > Programs and Features and click Turn Windows features on or off on the left pane.
The Windows Features dialog box opens.
Expand the Hyper-V feature and select all the check boxes:
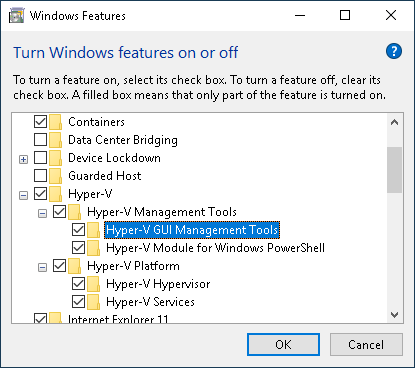
Click OK and proceed with the installation.
When the installation is complete, click Restart now.
Create and Configure a Virtual Machine
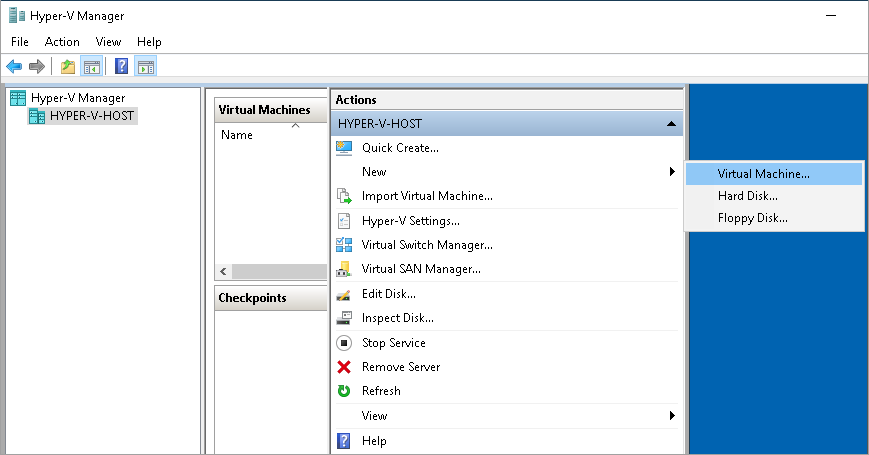
On your Hyper-V host (further, host), run Hyper-V Manager from the Start menu to create and configure a new VM (further, VM):
From the Actions panel, click New and select Virtual Machine... :
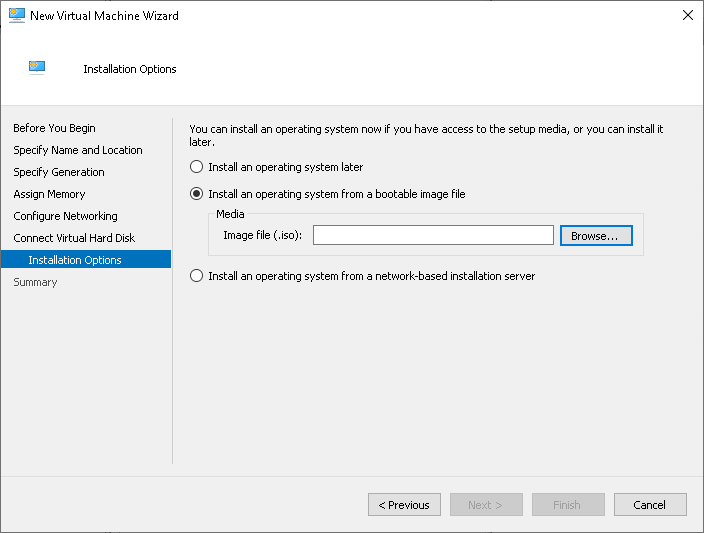
In the New Virtual Machine Wizard, specify all necessary parameters for the new machine (CPU configuration, Memory, Network, Hard Disk, and others).
Recommended system requirements for the VTune Profiler are 4 GB RAM and at least 10 GB free disk space.
Configure your installation source. For example, you can use local installation .iso image:
Start the newly created VM and proceed with the OS installation process.
Configure the Virtual Machine for the Hardware Analysis
Prepare a target system instance for profiling by exposing PMU/PEBS/LBR to the VM:
Turn off the newly created VM and launch your host Windows PowerShell as an Administrator from the Start menu.
In the PowerShell, configure your VM to expose PMU, PEBS, LBR to the VM as follows:
Set-VMProcessor -VMName your_vm_name -Perfmon pmu,pebs,lbr
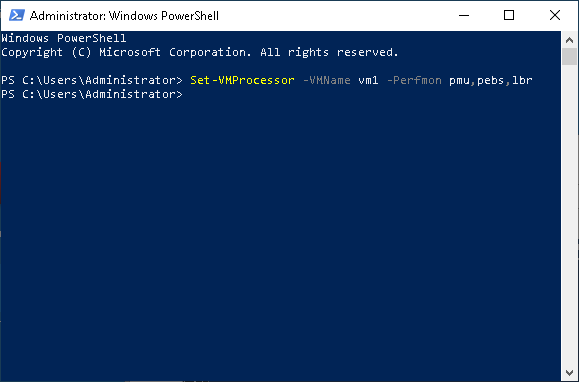
Turn on your VM.
Note
For additional guidance, see the Enable Intel Performance Monitoring Hardware in a Hyper-V virtual machine article.Run Hotspots Analysis
Run the VTune Profiler directly from the VM:
Install the VTune Profiler on the VM.
Run the VTune Profiler from Start menu.
Create a project.
The Configure Analysis window opens.
On the WHERE pane, select Local Host.
On the WHAT pane, specify the location of your application and its working directory.
On the HOW pane, select the Hardware Event-Based Sampling collection mode for the Hotspots analysis.
If you succeed with exposing PMU/PEBS/LBR, your analysis configuration pane will show no error messages and you will be able to perform the analysis.
Click
 Start to run the analysis.
The analysis result opens in the default Hotspots by CPU Utilization viewpoint.
Note
You may perform the Hotspots analysis in multiple VMs running simultaneously.