This recipe uses Intel® VTune™ Profiler for .NET Core dynamic-code profiling to locate performance hotspots in the managed code and optimize the application turnaround.
Content expert: Denis Pravdin
Ingredients
This section lists the hardware and software tools used for the performance analysis scenario.
Application: a sample C# application that adds all the elements of an integer List. The application is used as a demo and not available for download.
Tools:
Intel® VTune™ Profiler 2018
Note
Starting with the 2020 release, Intel® VTune™ Amplifier has been renamed to Intel® VTune™ Profiler.
Most recipes in the Intel® VTune™ Profiler Performance Analysis Cookbook are flexible. You can apply them to different versions of Intel® VTune™ Profiler. In some cases, minor adjustments may be required.
Get the latest version of Intel® VTune™ Profiler:
From the Intel® VTune™ Profiler product page.
Download the latest standalone package from the Intel® oneAPI standalone components page.
Operating system: Microsoft* Windows* 10
CPU: Intel microarchitecture code name Skylake
Prepare Your Application for Analysis
Open a new command window for the .NET environment variables to take effect. Make sure that .NET Core 2.0 is successfully installed:
dotnet --versionCreate a new listadd directory for the application:
mkdir C:\listadd
> cd C:\listadd
Enter dotnet new console to create a new skeleton project with the following structure:
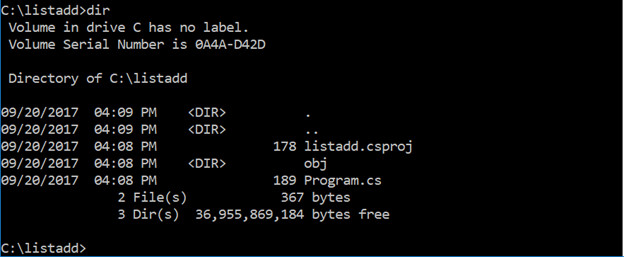
Replace the contents of Program.cs in the listadd folder with C# code that adds the elements of an integer List:
using System;
using System.Linq;
using System.Collections.Generic;

namespace listadd
{
    class Program
    {
        static void Main(string[] args)
        {
            Console.WriteLine("Starting calculation...");
            List<int> numbers = Enumerable.Range(1,10000).ToList();
            for (int i =0; i < 100000; i ++)
            {
                ListAdd(numbers);
            }

            Console.WriteLine("Calculation complete");
        }

        static int ListAdd(List<int> candidateList)
        {
            int result = 0;
            foreach (int item in candidateList)
            {
                result += item;
            }

            return result;
        }
    }
}
Create listadd.dll in the C:\listadd\bin\Release\netcoreapp2.0 folder:
dotnet build -c ReleaseRun the sample application:
dotnet C:\listadd\bin\Release\netcoreapp2.0\listadd.dll
Run Advanced Hotspots Analysis
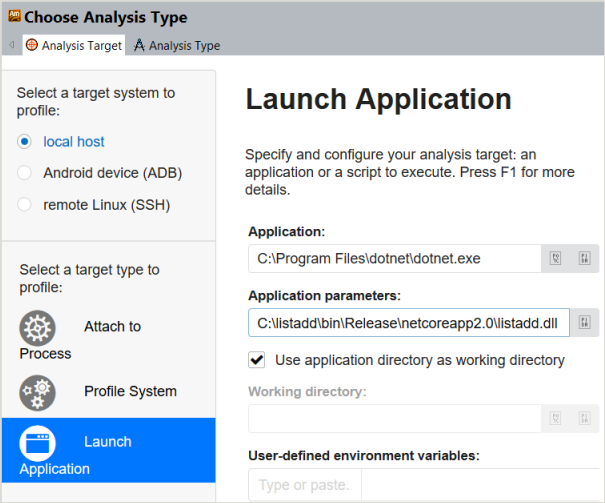
Launch VTune Profiler with administrator privileges.
Click the
 New Project button on the toolbar and specify a name for the new project, for example:
dotnet.
New Project button on the toolbar and specify a name for the new project, for example:
dotnet.
In the Analysis Target window, select local host and Launch Application target type from the left pane.
On the Launch Application pane, specify the application to analyze:
Application: C:\Program Files\dotnet\dotnet.exe
Application parameters: C:\listadd\bin\Release\netcoreapp2.0\listadd.dll
Note
The location of dotnet.exe depends on your environment and can be identified with the command: where dotnet.
Click the Choose Analysis button on the right and select the Advanced Hotspots analysis from the left pane.
Note
Advanced Hotspots analysis was integrated into the generic Hotspots analysis starting with Intel VTune Amplifier 2019, and is available via the Hardware Event-Based Sampling collection mode.
Click Start to run the analysis.
Identify Hotspots in the Managed Code
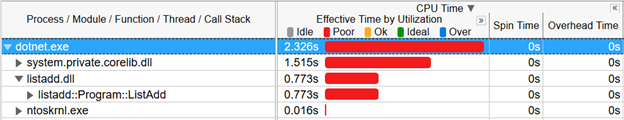
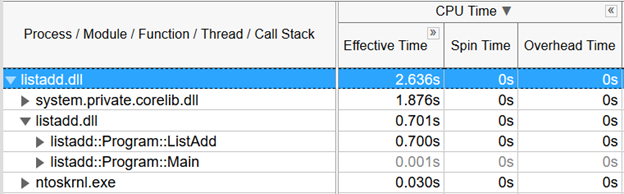
When the collected analysis result opens, switch to the Bottom-up tab and set the data grouping level to Process/Module/Function/Thread/Call Stack:
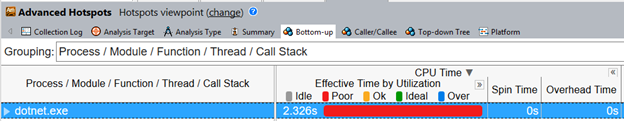
Expanding dotnet.exe > listadd.dll discovers the managed listadd::Program::ListAdd function that took the most CPU Time:
Double-click this hotspot function to open the source view. To view the source and disassembly code side by side, click the Assembly toggle button on the toolbar:
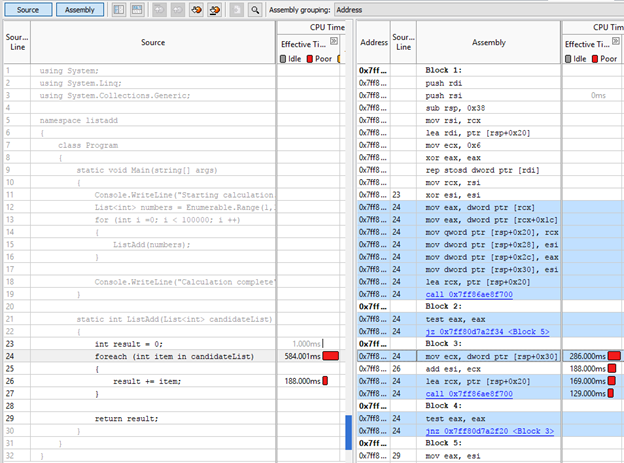
Use the statistics per source line/assembly instruction to identify the most time-consuming code snippets (line 24 in the example above) and work on optimizations.
Optimize the Code with Loop Interchange
VTune Amplifier highlights the following code line as performance-critical:
foreach (int item in candidateList)
For optimization, consider using the for loop statement. Replace the contents of Program.cs with this C# code:
using System;
using System.Linq;
using System.Collections.Generic;

namespace listadd
{
    class Program
    {
        static void Main(string[] args)
        {
            Console.WriteLine("Starting calculation...");
            List<int> numbers = Enumerable.Range(1,10000).ToList();
            for (int i =0; i < 100000; i ++)
            {
                ListAdd(numbers);
            }

            Console.WriteLine("Calculation complete");
        }

        static int ListAdd(List<int> candidateList)
        {
            int result = 0;
            for (int i = 0; i < candidateList.Count; i++)
            {
                result += candidateList[i];
            }

            return result;
        }
    }
}
Verify the Optimization
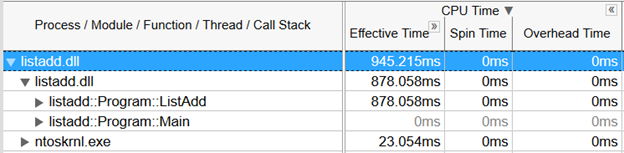
To verify the optimization for the updated code, re-run the Advanced Hotspots analysis.
Before the optimization the sample application took 2.636 seconds of CPU time:
After optimization the application ran for 0.945s, which is a 64% reduction in time over the original:
Note
To discuss this recipe, visit the developer forum