This recipe demonstrates the usage of Intel® VTune™ Profiler server in High Performance Computing (HPC) clusters for interactive performance profiling or accessing performance data for scheduled jobs.
Typically, nodes in HPC clusters do not have any GUI context. This can cause inconveniences when using VTune Profiler for performance analysis. Users in HPC clusters either have to rely on command-line reports or have to the transfer the result files out of the cluster to view them on other machines using the desktop VTune Profiler GUI.
This recipe aims to eliminate these inconveniences by offering a better workflow. Starting with VTune Profiler version 2021.1.1, you can launch VTune Profiler as a server inside the HPC cluster and view the results remotely with the full-featured GUI, requiring nothing more than a machine that can run a modern web browser.
Intel® DevCloud for oneAPI is used as an example in this recipe, but this workflow is valid for any other HPC cluster or similar environment.
Content experts: Stas Neverov
- Ingredients
- Directions
Ingredients
Here are the environment and software tools that you need:
- Access to Intel DevCloud for oneAPI
- Intel VTune Profiler—pre-installed on most HPC clusters, including Intel DevCloud for oneAPI.
Setup Overview
After you complete this setup, you will be able to:
- Book a compute node in an HPC cluster for interactive use, launch VTune Profiler server, and use the VTune Profiler web GUI on your laptop to configure analysis and view the collected data.
- Schedule your job in an HPC cluster, wrap it with VTune Profiler command-line data collection, return when the job is complete and run the VTune Profiler server to view collected results in a web browser on your laptop.
For both cases, you do not need to install anything on your client system. You only need a web browser to access the VTune Profiler GUI.
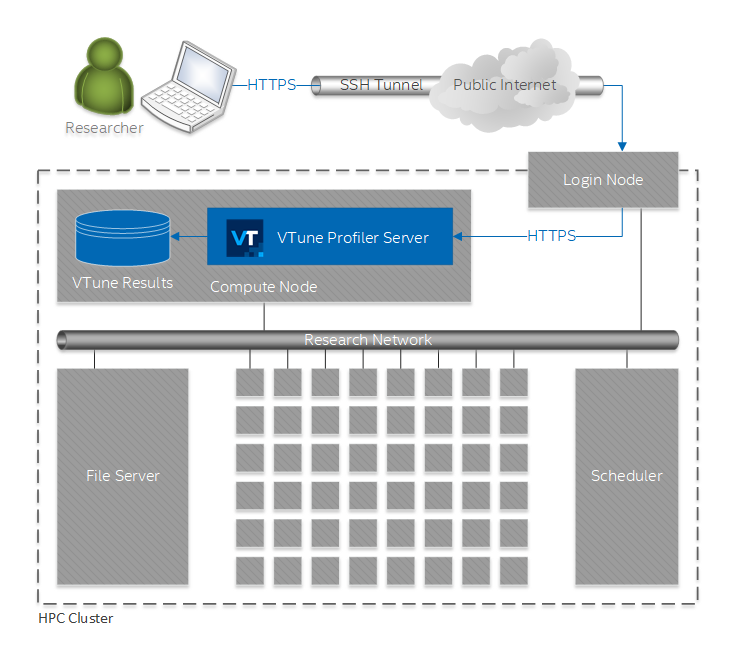
Interactive Performance Profiling with VTune Profiler Server
In this scenario, you run VTune Profiler server on a compute node inside an HPC cluster and access the VTune Profiler GUI via a web browser on your laptop. This usage model is somewhat similar to using VTune Profiler desktop GUI via VNC, but it is easier to set up and provides a better user experience.
This figure illustrates the setup for this scenario:
Follow these steps to enable this workflow:
- Log into Intel DevCloud for oneAPI.
- Set up an SSH connection into the Intel DevCloud by following the instructions:
- Log into the Intel DevCloud login node:
ssh devcloud - Reserve an Intel DevCloud compute node in interactive mode:
qsub -I - Run
VTune
Profiler server:
vtune-backend --enable-server-profiling --data-directory=~/intel/vtune/projectsVTune Profiler server outputs a string like this:
Serving GUI at https://127.0.0.1:42277?one-time-token=456e20b6dcaad209ea2157744c1dc6c5
Take note of the port number, compute node name, and the URL. You will need this information for the next steps.
Note
The port number—42277 in the sample output—is a random port out of those available on the compute node. Port number 42277 is used here as an example. It will be different when you start VTune Profiler server. - Open a new terminal window. Do not close the first terminal, as this will stop the VTune Profiler server and will release the compute node.
- Log into the DevCloud login node again, this time with SSH port forwarding enabled:
ssh -L 127.0.0.1:42277:127.0.0.1:42277 devcloudNote
Replace port 42277 with the actual port printed out in step 5. - Establish an SSH connection from the login node to the compute node with one more SSH tunnel:
ssh -L 127.0.0.1:42277:127.0.0.1:42277 s000-n000Note
Replace s000-n000 with the compute node name on which VTune Profiler server was started on step 5; replace port number 42277 with the actual port number from step 5. - Open the VTune Profiler web GUI on your laptop. To do this, paste the URL printed out by VTune Profiler server in step 5 into a web browser on your laptop.
- Accept the
VTune
Profiler server certificate.
When you open the VTune Profiler GUI, your web browser will prompt you about the VTune Profiler server self-signed certificate. You can proceed safely without installing the certificate, because the SSH tunnel provides protection from Man-in-the-Middle (MitM) attacks. For more information on transport security, see the Set Up Transport Security topic.
- Set the passphrase.
When you run VTune Profiler server for the first time, the URL that it prints should contain a one-time-token. When you open this URL in a browser, VTune Profiler server prompts you to set a passphrase. Other users cannot access your VTune Profiler server without the passphrase. The hash of the passphrase is persisted on the server in your user home directory. Also, your browser stores a secure HTTP cookie, so that you do not need to enter the passphrase each time you open the VTune Profiler web GUI.
Once you set the passphrase, the VTune Profiler Welcome screen opens.
- Create a new project and configure an analysis using
VTune
Profiler web GUI:
- Click the New Project... button on the Welcome screen.
- Enter the project name in the prompt dialog.
VTune Profiler automatically opens the Configure Analysis dialog.
Your compute node that is running the VTune Profiler server is selected as the target system by default.
- Set the target application path and any command-line arguments. See Set Up Analysis Target for details.
- Click the Start button to run the analysis.
Once the analysis completes, VTune Profiler opens the Summary tab of the analysis result.
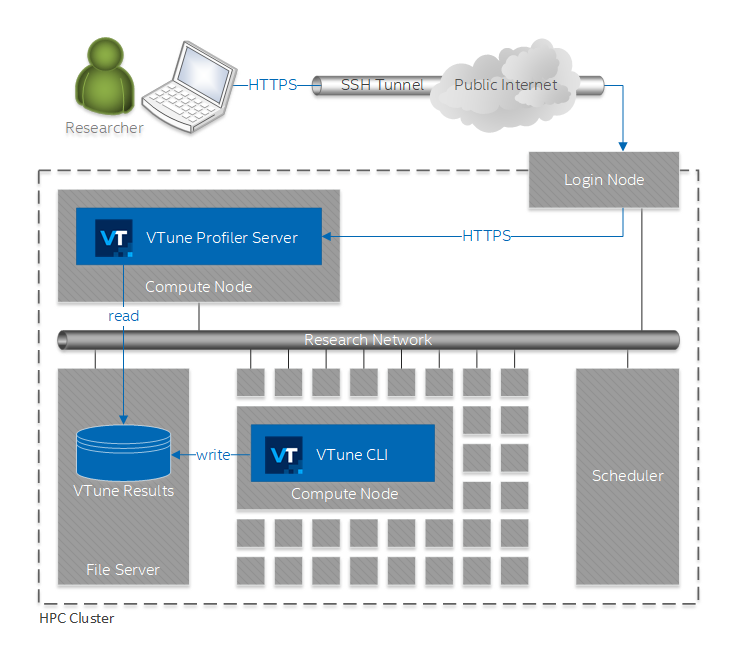
Serving Profiling Results for Scheduled Jobs
In this scenario, you collect performance data for scheduled jobs using the VTune Profiler command-line interface, and then serve these results by running VTune Profiler server inside the cluster. You can then access the results on your laptop via a web browser.
This figure illustrates the setup for this scenario:
Follow these steps to enable this workflow:
- Log into Intel DevCloud for oneAPI.
- Set up an SSH connection into the DevCloud by following the instructions:
- Log into the DevCloud login node:
ssh devcloud - Create a script to wrap a job with
VTune
Profiler data collection:
echo vtune -collect hotspots \
        -r ~/intel/vtune/projects/demo/matrix/hotspots01 \
        -- /opt/intel/oneapi/vtune/latest/samples/en/C++/matrix/matrix \
    > ~/run_with_vtune.sh
The -r ~/intel/vtune/projects/demo/matrix/hotspots01 option defines where the collected VTune Profiler result will be stored. You can change this location, but, when you start VTune Profiler server at a later step, it should point to some parent folder of this location, e.g. ~/intel/vtune/projects.
Note
- We assume that the user home directory is network mounted, and thus shared between all compute nodes.
- Some HPC clusters could have an additional network mounted space that you could use to store VTune Profiler results. This might be a good idea since VTune Profiler results are typically large in size and your user home directory space is likely limited.
- You can replace the sample /opt/intel/oneapi/vtune/latest/samples/en/C++/matrix/matrix with your own application.
- Schedule a job using the script created in step 4:
qsub ./run_with_vtune.sh - Wait for the job to complete.
The sample matrix application will take about a minute to complete. Your real-life HPC jobs could take hours to complete. You do not need to wait for the job to complete and can resume this flow the next day—your VTune Profiler results will be waiting for you in the specified location.
- Reserve a DevCloud compute node in interactive mode:
qsub -I - Run
VTune
Profiler server:
vtune-backend --data-directory=~/intel/vtune/projectsThe --data-directory=~/intel/vtune/projects should refer to some parent folder of the result folder that you specified in step 4.
VTune Profiler server outputs a string like this:
Serving GUI at https://127.0.0.1:42277?one-time-token=456e20b6dcaad209ea2157744c1dc6c5
Take note of the port number, compute node name, and the URL. You will need this information for the next steps.
Note
The port number—42277 in the sample output—is a random port out of those available on the compute node. Port number 42277 is used here as an example. It will be different when you start VTune Profiler server. - Open a new terminal window. Do not close the first terminal, as this will stop the VTune Profiler server and will release the compute node.
- Log into the DevCloud login node again, this time with SSH port forwarding enabled:
ssh -L 127.0.0.1:42277:127.0.0.1:42277 devcloudNote
Replace port number 42277 with the actual port number from step 8. - Establish an SSH connection from the login node to the compute node with one more SSH tunnel:
ssh -L 127.0.0.1:42277:127.0.0.1:42277 s000-n000Note
Replace s000-n000 with the compute node name on which VTune Profiler server was started on step 8; replace port number 42277 with the actual port number from step 8. - Open the VTune Profiler GUI on your laptop. To do this, paste the URL printed out by VTune Profiler server in step 8 into a web browser on your laptop.
- Accept the
VTune
Profiler server certificate.
When you open the VTune Profiler GUI, your web browser will prompt you about the VTune Profiler server self-signed certificate. You can proceed safely without installing the certificate, because the SSH tunnel provides protection from Man-in-the-Middle (MitM) attacks. For more information on transport security, see the Set Up Transport Security topic.
- Set the passphrase.
When you run VTune Profiler server for the first time, the URL that it prints should contain a one-time-token. When you open this URL in a browser, VTune Profiler server prompts you to set a passphrase. Other users cannot access your VTune Profiler server without the passphrase. The hash of the passphrase is persisted on the server in your user home directory. Also, your browser stores a secure HTTP cookie, so that you do not need to enter the passphrase each time you open the VTune Profiler GUI.
Once you set the passphrase, the VTune Profiler Welcome screen opens.
- Open the analysis result for the scheduled job.
You should see a demo/matrix/hotspots01 result in the Project Navigator panel. Double-click this result to open it.
Usage Considerations
- You can use the --enable-server-profiling command-line option to enable the system that hosts the VTune Profiler server as the performance profiling target. This option is disabled by default for security reasons, since running an analysis with VTune Profiler involves launching a target application with an arbitrary command line. If multiple users have access to a single instance of VTune Profiler server, they would be able to execute arbitrary code on behalf of the user account that runs the VTune Profiler server. Enable the --enable-server-profiling option only when VTune Profiler server is intended for a single user and you do not share the passphrase to access the server.
- Use the --web-port=PORT command-line option to run VTune Profiler server on a specific port. Otherwise, VTune Profiler server will run on an arbitrary port available on the system.
- VTune
Profiler server displays this warning in the output:
warn: Server access is limited to localhost only. To enable remote access restart with --allow-remote-access.
Because the usage models described above use SSH port forwarding, you do not need to enable --allow-remote-access. Incoming connections to the VTune Profiler server come from the SSH server, and thus are essentially localhost connections.
If you enable the --allow-remote-access option, VTune Profiler server builds a URL with the real network card IP address or FQDN name, which may not be accessible from your client machine.
- By default, VTune Profiler server stores profiling results in your home directory. Use the --data-directory command-line argument to specify a different data directory. You can also use this argument to open pre-collected VTune Profiler results in VTune Profiler server. VTune Profiler can locate its results in any child folders.