1
|
Select Loops by Mouse Rect: Select one or more loops/functions by tracing a rectangle with your mouse.
Zoom by Mouse Rect: Zoom in and out by tracing a rectangle with your mouse. You can also zoom in and out using your mouse wheel.
Move View By Mouse: Move the chart left, right, up, and down.
Undo or
Redo: Undo or redo the previous zoom action.
Cancel Zoom: Reset to the default zoom level.
Export as x: Export the chart as a dynamic and interactive HTML or SVG file that does not require the
Intel Advisor viewer for display. Use the arrow to toggle between the options.
|
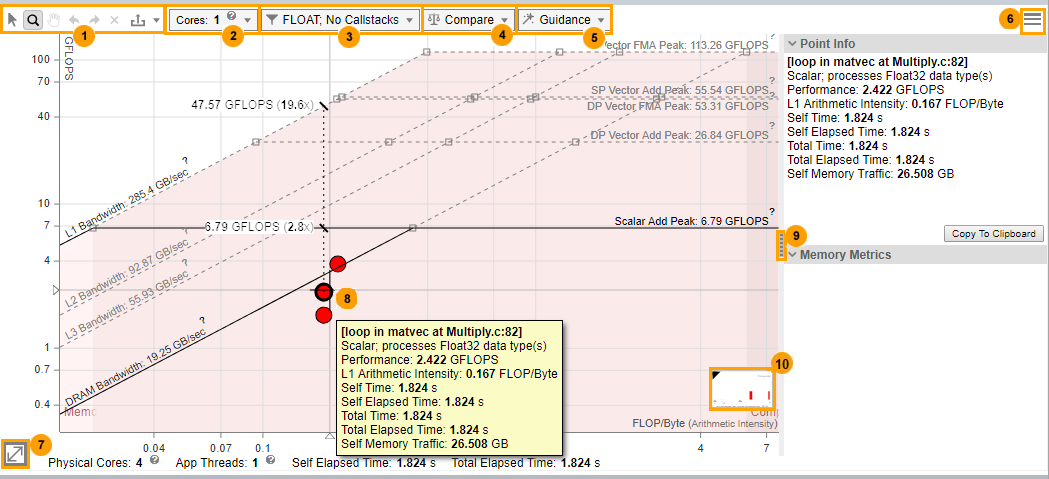
2
|
Use the
Cores drop-down toolbar to:
Adjust rooflines to see practical performance limits for your code on the host system.
Build roofs for single-threaded applications (or for multi-threaded applications configured to run single threaded, such as one thread-per-rank for MPI applications. (You can use Intel Advisor filters to control the loops displayed in the
Roofline chart; however, the
Roofline chart does not support the
Threads filter.)
Choose the appropriate number of CPU cores to scale roof values up or down:
1 – if your code is single-threaded
Number of cores equal or close to the number of threads – if your code has fewer threads than available CPU cores
Maximum number of cores – if your code has more threads than available CPU cores
By default, the number of cores is set to the number of threads used by the application (even values only).
You’ll see the following options if your code is running on a multisocket PC:
Choose
Bind cores to 1 socket (default) if your application binds memory to one socket. For example, choose this option for MPI applications structured as one rank per socket.
Note This option may be disabled if you choose a number of CPU cores exceeding the maximum number of cores available on one socket.
Choose
Spread cores between all n sockets if your application binds memory to all sockets. For example, choose this option for non-MPI applications.
|
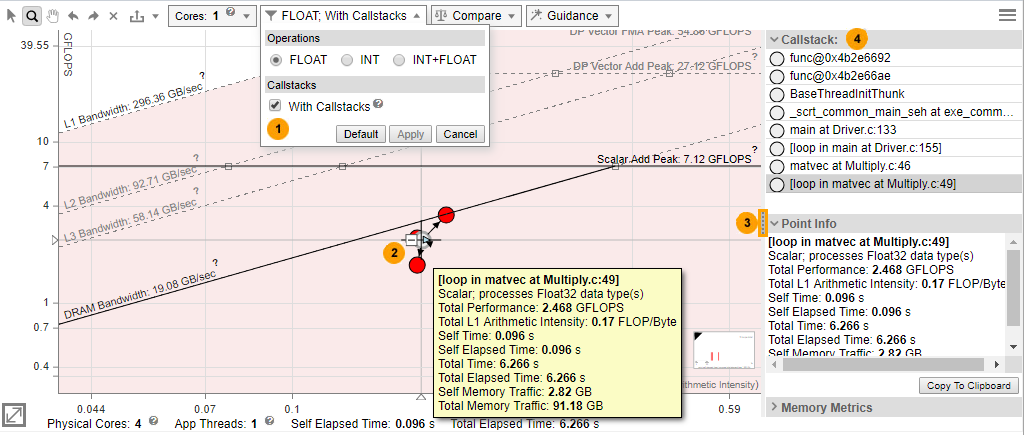
3
|
Toggle the display between floating-point (FLOP), integer (INT) operations, and mixed operations (floating-point and integer).
If you collected Roofline with Calltacks: Enable the display of Roofline with Callstacks additions to the
Roofline chart.
|
4
|
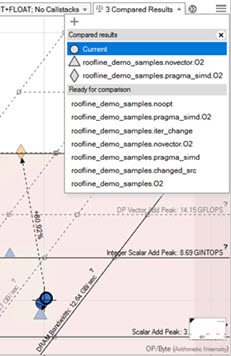
Display
Roofline chart data from other
Intel Advisor results or non-archived snapshots for comparison purposes.
Use the drop-down toolbar to:
Load a result/snapshot and display the corresponding filename in the
Compared Results region.
Clear a selected result/snapshot and move the corresponding filename to the
Ready for comparison region.
Note: Click a filename in the
Ready for comparison region to reload the result/snapshot.
Save the comparison itself to a file.
Note The arrowed lines showing the relationship among loops/functions do not reappear if you upload the comparison file.
Click a loop/function dot in the current result to show the relationship (arrowed lines) between it and the corresponding loop/function dots in loaded results/snapshots.
|
5
|
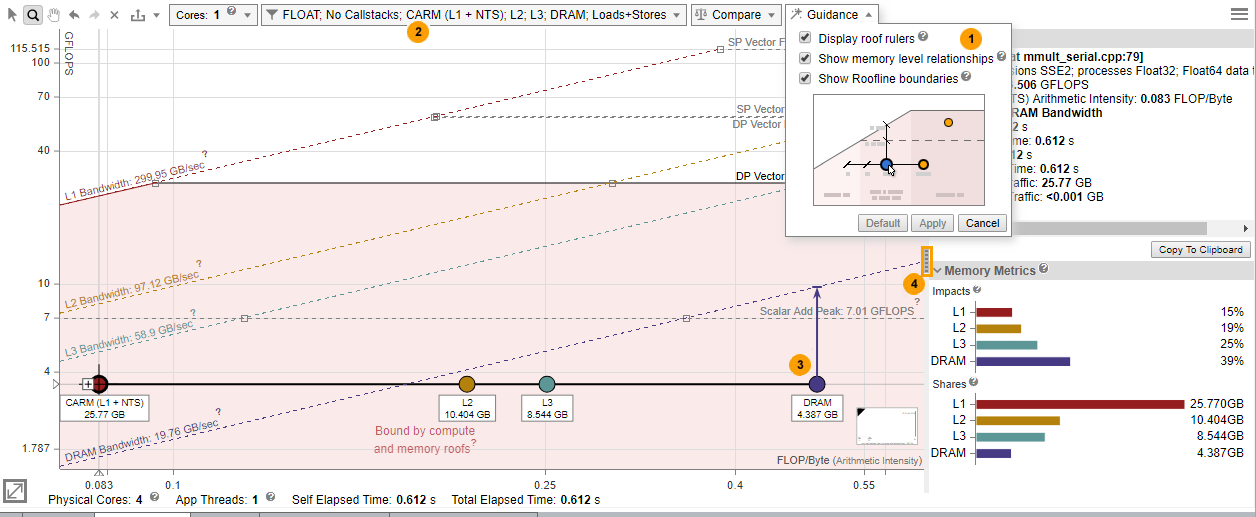
Add visual indicators to the Roofline chart to make the interpretation of data easier, including performance limits and whether loops/functions are memory bound, compute bound, or both.
Use the drop-down toolbar to:
Show a vertical line from a loop/function to the nearest and topmost performance ceilings by enabling the
Display roof rulers checkbox. To view the ruler, hover the cursor over a loop/function. Where the line intersects with each roof, labels display hardware performance limits for the loop/function.
If you collected Roofline for All Memory Levels: Visually emphasize the relationships among displayed memory levels and roofs and for a selected loop/function dot by enabling the
Show memory level relationships checkbox.
Color the roofline zones to make it easier to see if enclosed loops/functions are fundamentally memory bound, compute bound, or bound by compute and memory roofs by enabling the
Show Roofline boundaries checkbox.
The preview picture is updated as you select guidance options, allowing you to see how changes will affect the Roofline chart’s appearance. Click
Apply to apply your changes, or
Default to return the Roofline chart to its original appearance.
Once you have a loop/function's dots highlighted, you can zoom and fit the Roofline chart to the dots for the selected loop/function by once again double-clicking the loop/function or pressing
SPACE or
ENTER with the loop/function selected. Repeat this action to return to the original Roofline chart view.
To hide the labeled dots, select another loop/function, or double-click an empty space in the Roofline chart.
|
6
|
Roofline View Settings:
Adjust the default scale setting to show:
Roofs Settings:
Change the visibility and appearance of roofline representations (lines):
- Enable calculating roof values based on single-threaded benchmark results instead of multi-threaded.
- Click a
Visible checkbox to show/hide a roofline.
- Click a
Selected checkbox to change roofline appearance: display a roofline as a solid or a dashed line.
- Manually fine-tune roof values in the
Value column to set hardware limits specific to your code.
Loop Weight Representation: Change the appearance of loop/function weight representations (dots):
- Point Weight Calculation: Change the
Base Value for a loop/function weight calculation.
- Point Weight Ranges: Change the
Size,
Color, and weight
Range ® of a loop/function dot. Click the
+ button to split a loop weight range in two. Click the
- button to merge a loop weight range with the range below.
- Point Colorization: color loop/function dots by weight ranges or by type (vectorized or scalar). You can also change the color of loop with no self time.
You can save your Roofs Settings or Point Weight Representation configuration to a JSON file or load a custom configuration.
|
7
|
Zoom in and out using numerical values.
|
8
|
Click a loop/function dot to:
Right-click a loop/function dot or a blank area in the
Roofline chart to perform more functions, such as:
Further simplify the
Roofline chart by filtering out (temporarily hiding a dot), filtering in (temporarily hiding all other dots), and clearing filters (showing all originally displayed dots).
Copy data to the clipboard.
|
9
|
Show/hide the metrics pane:
- Review the basic performance metrics in the
Point Info pane.
- If you collected the Roofline for All Memory Levels: Review how efficiently the loop/function uses cache and what memory level bounds the loop/function in the
Memory Metrics pane.
|
10
|
Display the number and percentage of loops in each loop weight representation category.
|
 control to collapse descendant dots into the parent dot.
 control to show descendant dots and their relationship via visual indicators to the parent dot.